Chart of The Day DXY (US Dollar Index)
Chart of the Day DXY (US Dollar Index)
DXY (US Dollar Index) Potential Reversal Zone - Probable Price Path
Wall Street hit the skids again after Fed speakers took turns to warn about the need for fiscal stimulus to shore up the US economic recovery. Fed chair Powell stressed the need for fiscal aid (“the power of fiscal policy is really unequalled by anything else), while Clarida opined that “the economy is recovering robustly, but we are still in a deep hole”. The US Justice Department also proposed to Congress to curb legal immunity for tech companies. With the prevailing risk-off mood, the S&P 500 index lost 2.37% to a 8-week low while VIX rose to 28.58 and USD rallied. UST bonds range traded again with the 10-year yield stuck at 0.67% for now even though the 5-year sale was well received at a record low of 0.275%. Meanwhile, RBNZ and BOT both kept their policy settings static yesterday, but clear hints was seen in the former that prolonged monetary support is necessary and instruments will include a Funding for Lending Programme, a negative OCR and purchases of foreign assets.
The manufacturing PMI rose from 53.1 to 53.5 in September, whilst the services PMI slipped from 55 to 54.6, but both still signalling a growth recovery in 3Q20. Meanwhile, Rosengren opined that the US would be lucky to get 2% inflation in four years as “the most difficult part of the recovery is still ahead of us”, while Evans noted his forecast had incorporated an expectation of $1t in further fiscal support. Clarida also noted that the Fed will only begin to think of rate hikes when there are at least a few months of 2% yoy inflation as well as full employment.
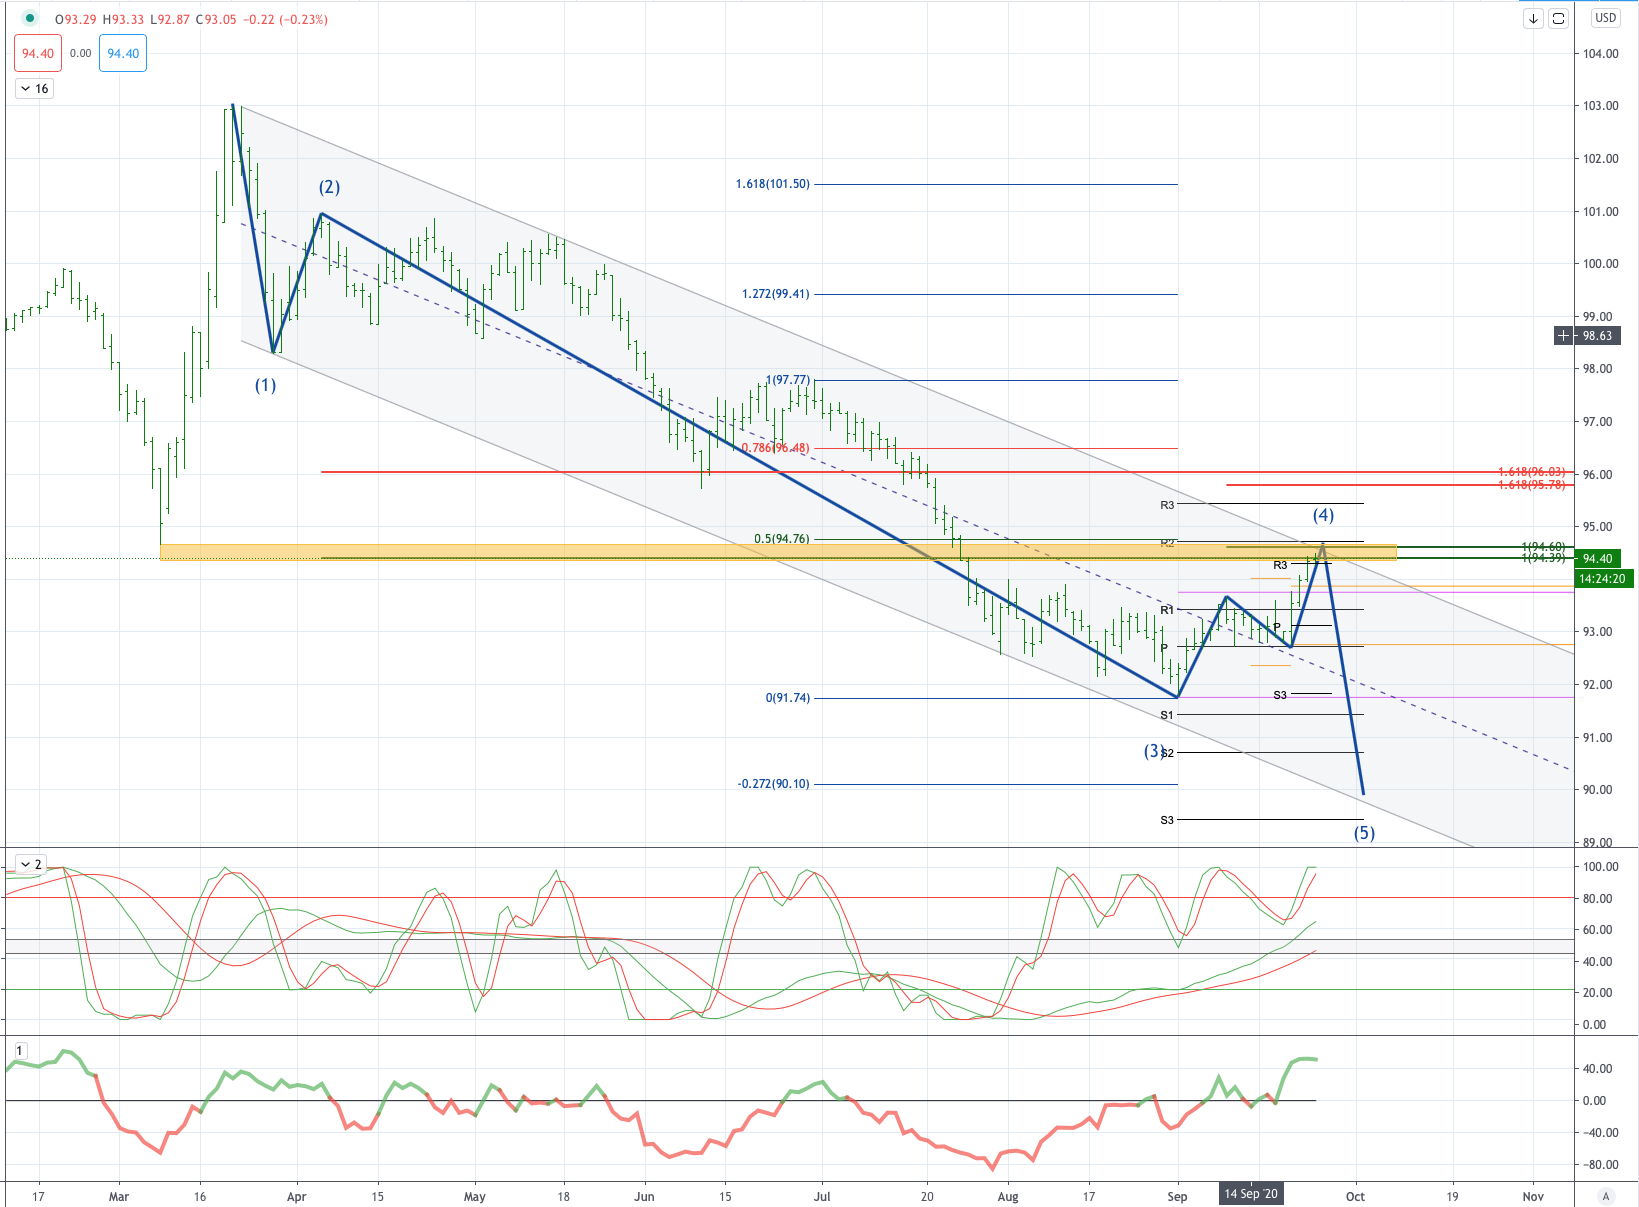
From a technical and trading perspective, the DXY is testing pivotal trend resistance at 94.50 this level has significant technical confluence as it represents and equality objective, symmetry swing resistance, the 50% Fibonacci retracement from the July highs and the descending channel trendline resistance and finally the horizontal structural level of the March crisis lows. Dollar bears will be watching how price responds at this area looking for both intraday and daily reversal patterns to potentially print a wave 4 high, if these reversal patterns play out then bearish exposure should be rewarded targeting an ideal wave 5 objective at 90.00. On the day a close through 95.00 would bring the wave 4 thesis into doubt and open a move to test 96.00 the next confluent resistance zone. Obviously if the wave 4 thesis does play out this will have significant implications for the FX majors EURUSD, USDCHF, USDJPY, GBPUSD all testing pivotal support and resistance zones. Join me today at 1pm UK time where I will go into further detail regarding these setups. You can register here
Disclaimer: The material provided is for information purposes only and should not be
considered as investment advice. The views, information, or opinions expressed in the text belong solely to the author, and not to the author’s employer, organization, committee or other group or individual or company.
High Risk Warning: CFDs are complex instruments and come with a high risk of losing money rapidly due to leverage. 73% and 76% of retail investor accounts lose money when trading CFDs with Tickmill UK Ltd and Tickmill Europe Ltd respectively. You should consider whether you understand how CFDs work and whether you can afford to take the high risk of losing your money.
Disclaimer: The material provided is for information purposes only and should not be considered as investment advice. The views, information, or opinions expressed in the text belong solely to the author, and not to the author’s employer, organization, committee or other group or individual or company.
Past performance is not indicative of future results.
High Risk Warning: CFDs are complex instruments and come with a high risk of losing money rapidly due to leverage. 71% and 74% of retail investor accounts lose money when trading CFDs with Tickmill UK Ltd and Tickmill Europe Ltd respectively. You should consider whether you understand how CFDs work and whether you can afford to take the high risk of losing your money.
Futures and Options: Trading futures and options on margin carries a high degree of risk and may result in losses exceeding your initial investment. These products are not suitable for all investors. Ensure you fully understand the risks and take appropriate care to manage your risk.
Patrick has been involved in the financial markets for well over a decade as a self-educated professional trader and money manager. Flitting between the roles of market commentator, analyst and mentor, Patrick has improved the technical skills and psychological stance of literally hundreds of traders – coaching them to become savvy market operators!