机构洞察:高盛 #SP500 的定位、情绪和关键水平

Institutional Insights: Goldman Sachs #SP500 Positioning, Sentiment & Key Levels
Update from Goldman Sachs on current positioning metrics.
1. CTA Corner: We have CTAs modelled long +$70bn of global equities (66th %tile) after selling $43bn of equities last week globally.
2. GS PB: The GS Equity Fundamental L/S Performance Estimate rose +0.42% between 9/6 and 9/12 (vs MSCI World TR +1.25%), driven by beta of +0.25% (from market exposure) and alpha of +0.18% on the back of long side gains. The GS Equity Systematic L/S Performance Estimate2 fell -0.18% during the same period, driven almost entirely by alpha on the back of long side losses as beta finished ~flat .
3. Buybacks: Friday 9/13 marked the first day of blackout window for corporates. We estimate blackout will run through 10/25. As of today, we est. ~55% of corporates are in their closed period (link).
CTA Corner CTA Flows: • Over the next 1 week…
Flat tape: -$5bn to sell (+$1bn SPX to buy)
Up tape: +$3bn to buy (+$665m SPX to buy)
Down tape: -$30bn to sell (-$1.5bn SPX to sell) •
Over the next 1 month…
Flat tape: +$15bn to buy (+$3.5bn SPX to buy)
Up tape: +$66bn to buy (+$5bn SPX to buy)
Down tape: -$141bn to sell (-$36bn SPX to sell) •
Key pivot levels for SPX:
Short term: 5526
Med term: 5358
Long term: 4938
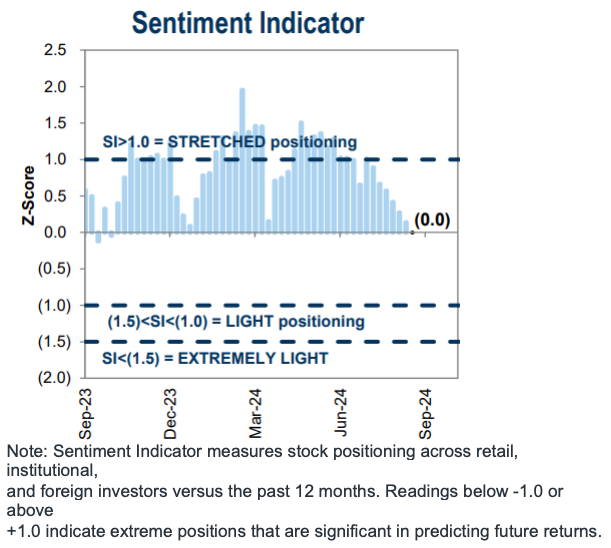
Charts in Focus
The GS Sentiment Indicator registered 0 last week – the lowest reading since October 2023. Reminder: The Sentiment Indicator (SI) is a measure of aggregate positioning and risk sentiment in the US equity market. The Sentiment Indicator tracks investor positioning across the more than 80% of the US equity market that is owned by institutional, retail and foreign investors
免责声明:提供的材料仅供参考,不应视为投资建议。 本文中表达的观点,信息或观点仅属于作者,而不属于作者的雇主,组织,委员会或其他团体或个人或公司。
过去的业绩不代表未来的结果。
高风险警告:差价合约(CFD)是复杂的工具,由于杠杆作用,存在快速亏损的高风险。 当与Tickmill UK Ltd和Tickmill Europe Ltd进行差价合约交易时,分别有69%和73%的零售投资者账户亏损。 您应该考虑自己是否了解差价合约的工作原理,以及是否有具有承受损失资金的的高风险的能力。
期货和期权:保证金交易期货和期权具有高风险,可能导致损失超过您的初始投资。这些产品并不适合所有投资者。请确保您完全了解这些风险,并采取适当的措施来管理您的风险。