SP500 LDN TRADING UPDATE 5/03/25
SP500 LDN TRADING UPDATE 5/03/25
WEEKLY BULL BEAR ZONE 6025/35
WEEKLY RANGE RES 6080 SUP 5836
DAILY BULL BEAR ZONE 5795/85
DAILY RANGE RES 5867 SUP 5783
EQUALITY TARGET AGAINST 6000 SWING HIGH 5680
5680 MONTHLY PROJECTED RANGE SUPPORT
WEEKLY ACTION AREA VIDEO
TODAY'S TRADE LEVELS & TARGETS
SHORT ON TEST/REJECT DAILY RANGE RES TARGET DAILY BULL BEAR ZONE
LONG ON TEST/REJECT OF DAILY BULL BEAR ZONE TARGET DAILY RANGE RES
SHORT ON ACCEPTANCE BELOW 5720 TARGET 5680
LONG ON TEST/REJECT OF 5680 TARGET 5780
GOLDMAN SACHS TRADING DESK VIEWS
.U.S. EQUITIES UPDATE: WHIPLASH
FICC and Equities | 4 March 2025 |
Market Overview:
- S&P 500: -122 bps, closing at 5778 with a MOC of $4B to SELL.
- NASDAQ 100 (NDX): -36 bps, closing at 20,352.
- Russell 2000 (R2K): +108 bps, finishing at 2079.
- Dow Jones (Dow): -155 bps, ending at 42,520.
Key Metrics:
- Total U.S. equity trading volume: 18.4B shares, above the YTD daily average of 15.3B shares.
- VIX: +320 bps to 23.51.
- Crude Oil: -99 bps to $67.67.
- US 10-Year Yield: +9 bps to 4.24%.
- Gold: +78 bps to $2,915.
- DXY (Dollar Index): -106 bps to 105.61.
- Bitcoin: +423 bps to $88,891.
Market Sentiment:
Yesterday’s market action was muted as traders remained cautious, but today saw a slight uptick in activity, with risk being trimmed at the margins by both hedge funds (HFs) and long-only investors (L/Os). Many investors were holding out hope that tariffs on Mexico and Canada were merely a negotiating ploy—unfortunately, they were not. Target’s macro commentary this morning also added to the negative sentiment.
CTA supply has intensified following yesterday’s weak close, with $39B in U.S. equities expected to be sold over the remainder of the week at current market levels. The S&P 500 has now erased all post-election gains, losing $3.4T in value. The next technical support appears to be the S&P 500’s 200-day moving average at 5725, which could attract some real buyers. Notably, three rate cuts are now fully priced in for 2025.
Corporate buybacks are active during this dip, with our desk’s executed flows running at 1.3x last year’s daily average.
Closing Observations:
1. CTA volumes were significant at both the open and the close.
2. Buyback desk orders ceased at 3:50 PM.
3. Additional hedges were added ahead of Trump’s evening remarks.
4. Leveraged ETF strategies acted as synthetic short gamma.
Top-of-book liquidity, which began the year at $9.4M and peaked at $22.5M in mid-January, has now dropped to $4.4M. For context, the 1-year low was $2.8M on August 5th, 2024.
Desk Activity:
Overall activity levels on our floor were rated a 7 on a 1–10 scale.
- Our floor ended the day as net sellers at -190 bps, compared to a +50 bps 30-day average.
- L/Os were net sellers at -$1B, driven by supply in Industrials, Healthcare, and Discretionary.
- HFs were slight net buyers, primarily targeting macro trades and Industrials.
AFTER THE BELL:
- CRWD: -6%. Q4 revenues were only slightly better than expected, with net new ARR up 23% YoY, slightly below whispers. Q1 revenue guidance was in line with expectations.
- CRDO: +15%. Reported a strong beat for the quarter and provided robust Q4 guidance.
- ROST: -1.5%. Expectations were already low, and the company’s soft Q1 guidance confirmed those concerns. While Q4 results were modest, they failed to provide any upside surprise.
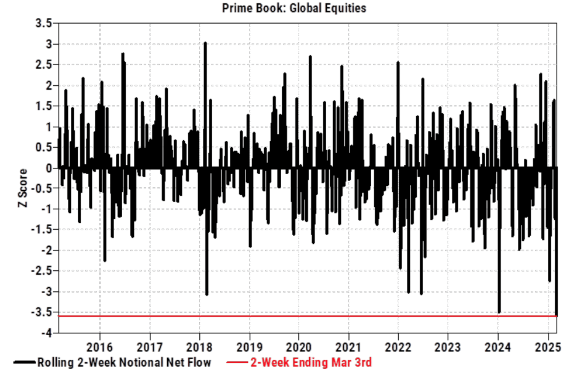
Although HF Gross exposure remains significantly high and poses a risk, here are a few noteworthy data points on Net flow and Net exposure that may serve as a counterbalance:
1. Over a two-week rolling period (since February 18th, when YTD Fundamental L/S returns peaked), global equities on the Prime book have experienced the largest two-week notional net selling in the past 10 years.
2. On a 10-day rolling basis as of today, Fundamental L/S Net leverage has decreased by 4.9 points—the steepest 10-day reduction since September 2022.
3. While Gross leverage continues to be elevated, both global Fundamental L/S and US Fundamental L/S Net leverage ratios have dropped significantly, now sitting well below their respective one-year averages, in the 22nd and 13th percentiles, respectively.
Disclaimer: The material provided is for information purposes only and should not be considered as investment advice. The views, information, or opinions expressed in the text belong solely to the author, and not to the author’s employer, organization, committee or other group or individual or company.
Past performance is not indicative of future results.
High Risk Warning: CFDs are complex instruments and come with a high risk of losing money rapidly due to leverage. 69% and 73% of retail investor accounts lose money when trading CFDs with Tickmill UK Ltd and Tickmill Europe Ltd respectively. You should consider whether you understand how CFDs work and whether you can afford to take the high risk of losing your money.
Futures and Options: Trading futures and options on margin carries a high degree of risk and may result in losses exceeding your initial investment. These products are not suitable for all investors. Ensure you fully understand the risks and take appropriate care to manage your risk.
Patrick has been involved in the financial markets for well over a decade as a self-educated professional trader and money manager. Flitting between the roles of market commentator, analyst and mentor, Patrick has improved the technical skills and psychological stance of literally hundreds of traders – coaching them to become savvy market operators!