Institutional Insights: JPMorgan Trading An Easing Cycle
Institutional Insights: JPMorgan Trading An Easing Cycle
According to JPMorgan "A typical rate cutting cycle is not always positive though in each of the last 5 cutting cycles, we have seen the SPX higher on a 1M, 3M, 6M, and 12M basis. Is that the expectation for this cycle? Yes, as we think the setup is most similar to the 1995 cutting cycle and less like 1998, 2001, 2007, or 2019. The last five easing cycles have seen the SPX add 2.5% over the next month, 6.1% over six months, and 4.5% over the following twelve months. NDX returns 6.4%, 8.6%, and 18.6% over those time frames and RTY 3.3%, 3.1%, and 4.9%. For reference, on a 1-month basis, the SPX has averaged a +0.77% return over the last 30 years; NDX averaged 1.33% and RTY averaged 0.77%. Annually, the SPX has averaged +10.1% annual return with NDX +19.1% and RTY +9.0%. Rereading this, the data skews bearish but the range of outcomes is broad, with 12-month SPX returns spanning +22.3% to negative 17.8%"
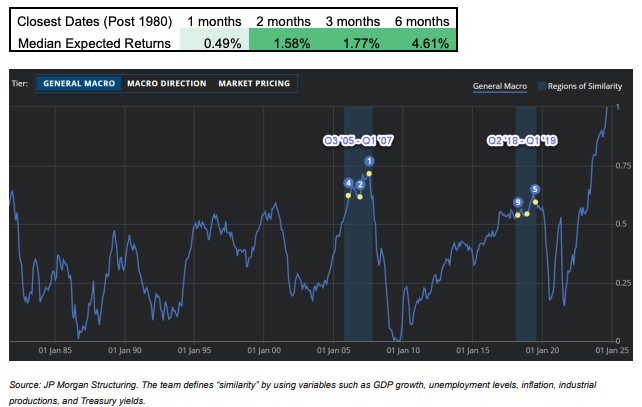
QUANTITATIVE HISTORICAL COMPARISON The following information comes from JP Morgan Structuring and their Time Traveler tool which seeks to find historical comparisons to current market conditions. They find the closest periods to today are 2005Q3 – 2007Q1 and 2018Q2 – 2019Q1. Picking their most similar days to today post-1980, below are the expected returns. For clients interested in exploring the Time Traveler too
BULL vs. BEAR
• BULL CASE – (i) Macro data that is supportive of the Soft Landing / No Landing narrative which could look like NFP ~150k with dovish CPI MoM; (ii) Consumers are re-engaged boosting the economy to above-trend growth, reflecting positively on earnings growth (iii) Positive fund flows more than offset negative seasonality; (iv) Improved investor sentiment and macro outlook leads to increased earnings outlook for 24H2 and FY25; (v) Fed cuts lead to multiple expansion; (vi) AI / TMT leads with participation from Cyclicals/Value
• BEAR CASE – (i) NFP has a negative surprise; (ii) CPI has an upside surprise; (iii) Fed disappoints; (iv) Negative seasonality triggers a correction, or worse; (v) US Election surprise triggers volatility; (vi) Elevated bond vol, potentially from Fed path uncertainty, pushes credit spreads wider and weighs on Equities; (vii) Fed cutting cycle triggers something akin to the JPY carry unwind.
US MARKET INTEL VIEW – Tactically Bullish. Following the playbook of at/above trend GDP growth combined with positive earnings growth and an accommodative Fed translates to a bullish view of stocks. Adding some color, this cutting cycle may be most similar to the 1995 cycle, and I view these ‘maintenance cuts’ as coming at a time with still strong household and corporate balance sheets. Further, the reduction in pressure on consumers from lower rates may translate to macro data that inflects higher as soon as this month, from a solid base illustrated by a 2% GDPNow estimate. Earnings delivery remains robust, with 91% of SPX having reported we saw 5.2% revenue growth, 10.8% earnings growth, and 12% profit margins compared to expectations of 4.5%, 8.5%, and 11.8%, respectively. Lastly, while the magnitude and cadence of the Fed’s easing cycle is up for debate, it will begin cutting this month and history suggests that is a positive for stocks when the macro environment is in its current state.
RISKS – (i) Positioning – while aggregate positioning has seen a rebound from the turmoil of early August, we have not seen HFs chasing this rally as they have been selling into strength, let’s see if their bearish view is rewarded; (ii) Seasonality – this century, September has been the worst month of the year averaging -1.7% return (54% hit rate) followed by Q4 being the best time of the year averaging +4.2% (79% hit rate) but if you look at only the last five years, the SPX averages -4.2% (80% hit rate) and Q4 averages +9.8% (100% hit rate). 2024 has not followed 5- year nor 10-year seasonal trends with each month ex-January delivering either a directional or magnitude surprise; (iii) US Election – election years tend to extend the negative September seasonality into October due to policy uncertainty. That both candidates and their policies are known to markets may reduce this effect; (iv) Geopolitics – the situations in both the Middle East and Ukraine have been largely ignored by Equity markets but keep an eye on events that draw either the US or Turkey (NATO) into either conflict. Bullish commodity bets may be the most prudent hedges.
Disclaimer: The material provided is for information purposes only and should not be considered as investment advice. The views, information, or opinions expressed in the text belong solely to the author, and not to the author’s employer, organization, committee or other group or individual or company.
Past performance is not indicative of future results.
High Risk Warning: CFDs are complex instruments and come with a high risk of losing money rapidly due to leverage. 69% and 73% of retail investor accounts lose money when trading CFDs with Tickmill UK Ltd and Tickmill Europe Ltd respectively. You should consider whether you understand how CFDs work and whether you can afford to take the high risk of losing your money.
Futures and Options: Trading futures and options on margin carries a high degree of risk and may result in losses exceeding your initial investment. These products are not suitable for all investors. Ensure you fully understand the risks and take appropriate care to manage your risk.
Patrick has been involved in the financial markets for well over a decade as a self-educated professional trader and money manager. Flitting between the roles of market commentator, analyst and mentor, Patrick has improved the technical skills and psychological stance of literally hundreds of traders – coaching them to become savvy market operators!