Institutional Insights: BofA Systematic Flows Monitor
Systematic Flows Monitor
Trend followers overweight US equities and USD with low unwind risk currently CTAs long US equities and neutral in Europe & Japan
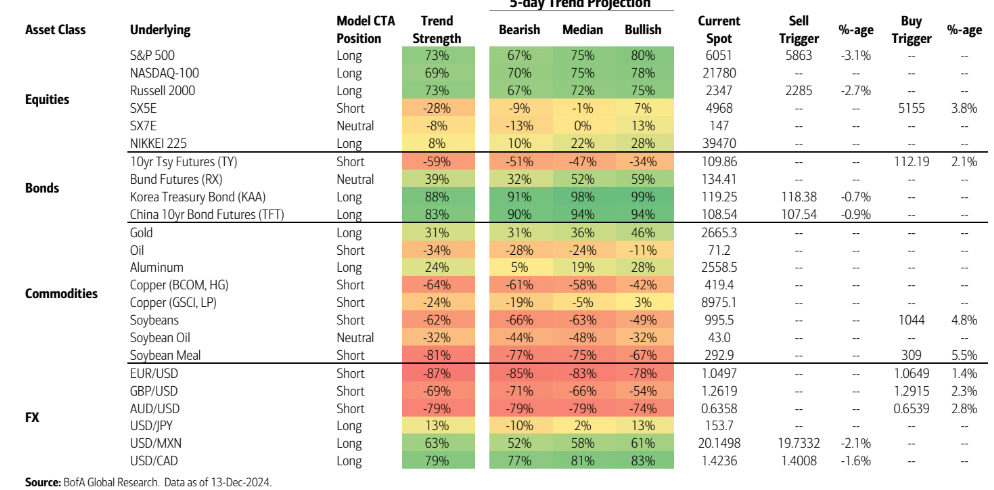
According to our model, CTAs remain long US equity indices, with positioning mostly unchanged despite declines in the S&P 500 and Russell 2000 this week. Trend followers may have recently seen larger short covering in the EURO STOXX 50 as the index has now increased on 11 of the last 12 trading days.
At this point, more CTAs than not could have decreased their shorts with positioning closer to neutral now. In Japan, Nikkei-225long positioning is still hanging around neutral levels, but trend follower buying could up should spot breakout to the upside. Heading into year-end, we'll be looking to see if CTA longs could push back to levels from this past July on what tends to be lower trading volumes and correspondingly lower realised volatility.
Higher US yields likely preserve CTA USTshort positionsUS 10yr yields saw their largest weekly increase since October 2023 as further rate cuts were priced out. In fact, our economics team now expects only three rate cuts in 2025 after a 25 bps cut at next week’s FOMC meeting. The move higher in yields likely benefitted trend followers, as we expect most were still short all tenors of UST futures, but we note that longer-term trend followers likely saw the largest gains from bonds as they may not have participated in shortcovering to the same extent as short-term trend followers.
Outside the US, trend followers could continue adding to Bund longs and CGBs and KTBs remain stretched long. USD sees another move higher, leaving CTA longs intact In FX,the Dollar saw its 10th weekly gain in the last 11 weeks, likely resulting in more FX gains for trend followers. According to our model, USD long positions are still stretched versus every currency we track except for JPY. The USD’s gains leave our trigger levels some distances away, but we will be monitoring next week's FOMC, BoE, and Banxicomeetings for any catalyst that brings our triggers closer.
In commodities, our model indicates CTAs are still long gold and short oil, copper, and soybeans. Average SPX gamma level sets new all-time-high. Over the last month, SPX gamma has averaged long $10.6bn, the largest on record for a 1-month period. As of Thursday’s close, SPXgamma was quite elevated at +$12.6bn (94th%ile ytd), a large portionof which is due to the 3rdFriday and year-end expirations (witha combined +$7bn). Behind the scenes, the SPXW Dec31 6055 calls have an outsized footprint of roughly +$4-5bn gamma due to ~40k contracts net long for dealers; these options have the potential to grow increasingly important into year-end if the S&P stays near the 6055 strike (by no means a given) and if the trade is not exited early.
Disclaimer: The material provided is for information purposes only and should not be considered as investment advice. The views, information, or opinions expressed in the text belong solely to the author, and not to the author’s employer, organization, committee or other group or individual or company.
Past performance is not indicative of future results.
High Risk Warning: CFDs are complex instruments and come with a high risk of losing money rapidly due to leverage. 69% and 73% of retail investor accounts lose money when trading CFDs with Tickmill UK Ltd and Tickmill Europe Ltd respectively. You should consider whether you understand how CFDs work and whether you can afford to take the high risk of losing your money.
Futures and Options: Trading futures and options on margin carries a high degree of risk and may result in losses exceeding your initial investment. These products are not suitable for all investors. Ensure you fully understand the risks and take appropriate care to manage your risk.
Patrick has been involved in the financial markets for well over a decade as a self-educated professional trader and money manager. Flitting between the roles of market commentator, analyst and mentor, Patrick has improved the technical skills and psychological stance of literally hundreds of traders – coaching them to become savvy market operators!