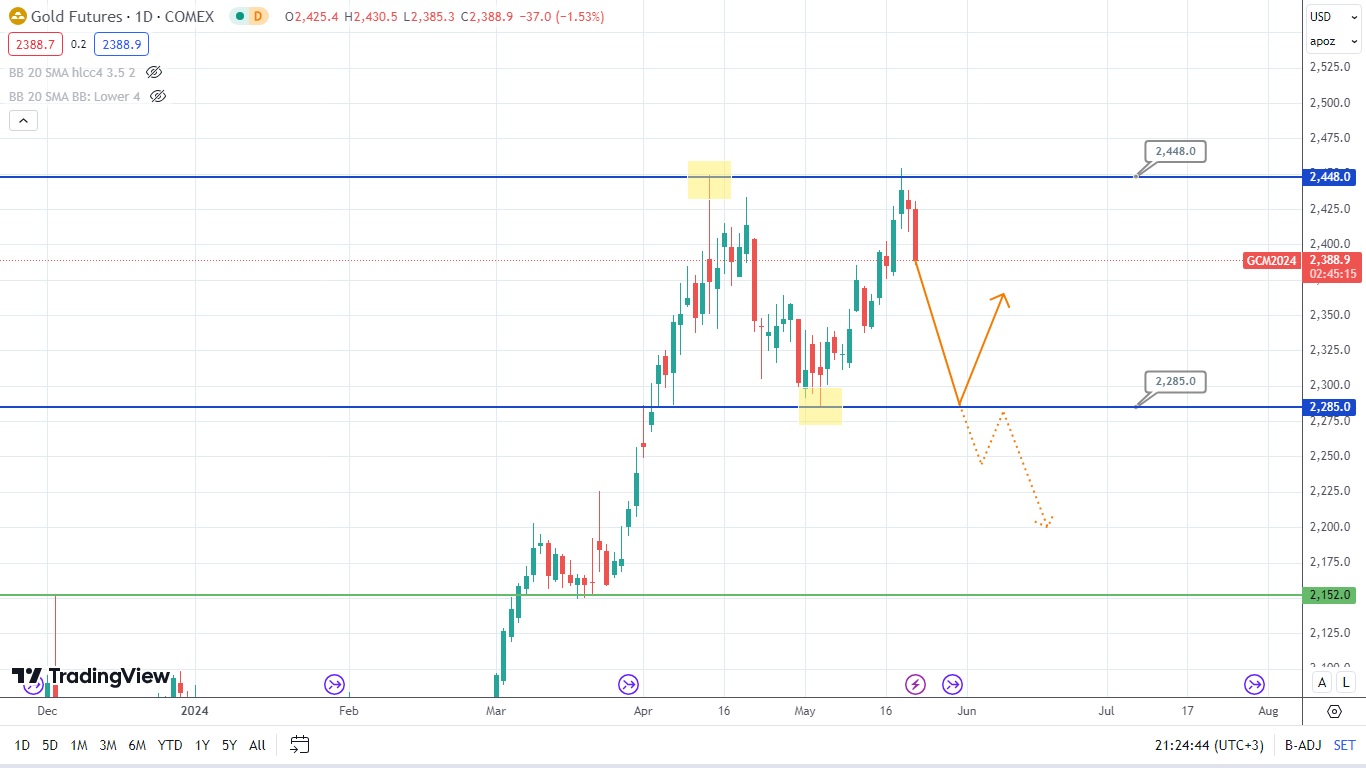
Gold Prices at a Crossroads: What’s Next?

The price of gold rebounded from the resistance level of 2448, signifying the upcoming formation of a potential top. Now, the price of this asset is heading down, targeting the level of 2285. This level can offer strong support and result in potential price growth. On the other hand, the asset’s price might also break the level, form a reversal pattern such as a double top, and drop. So, at this point, it would be wise to follow the candlestick formation to forecast the upcoming price movements.
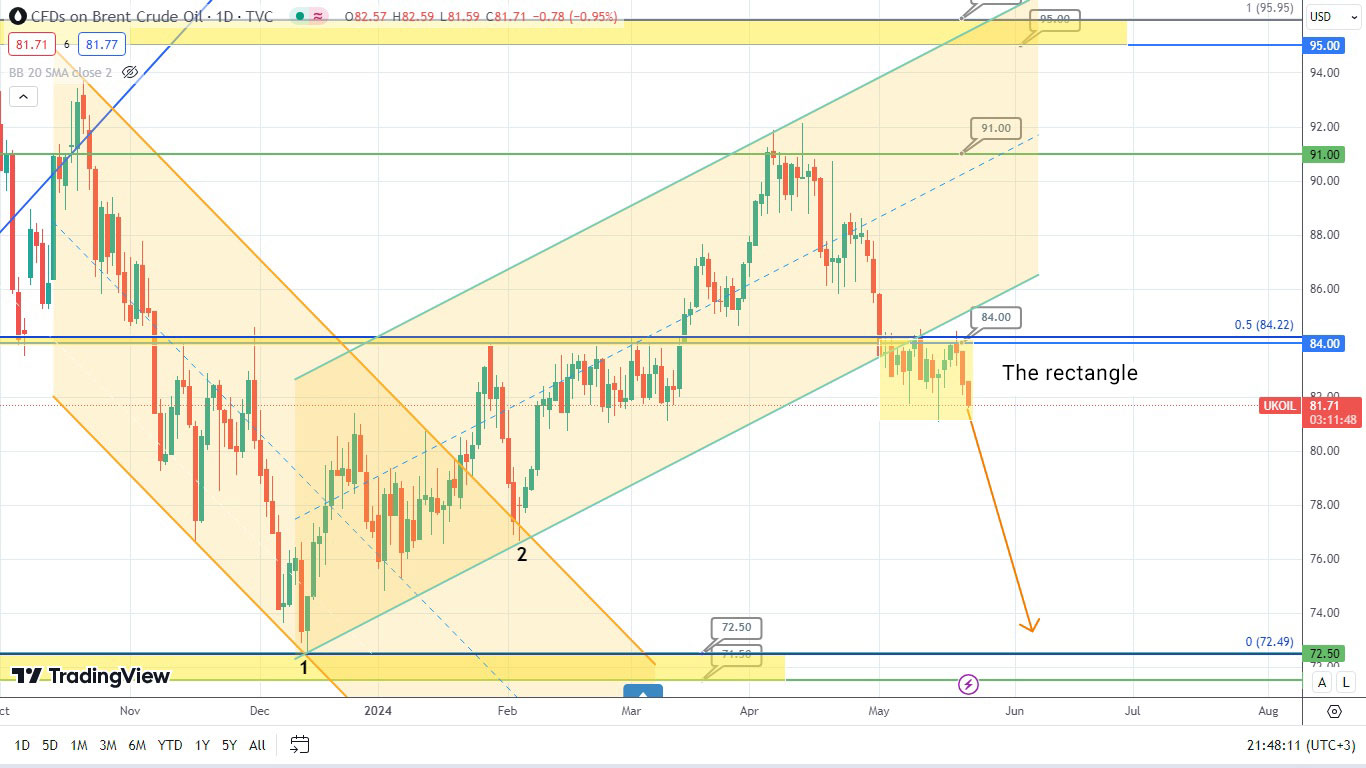
The price of Brent oil has repeatedly tested the broken level of 84.00. Currently, it is forming a very narrow range, that is a triangle. This pattern signifies an upcoming price drop. If the lower boundary of the rectangle gets broken, it might speed up the potential price drop. So, let’s observe what might happen next.
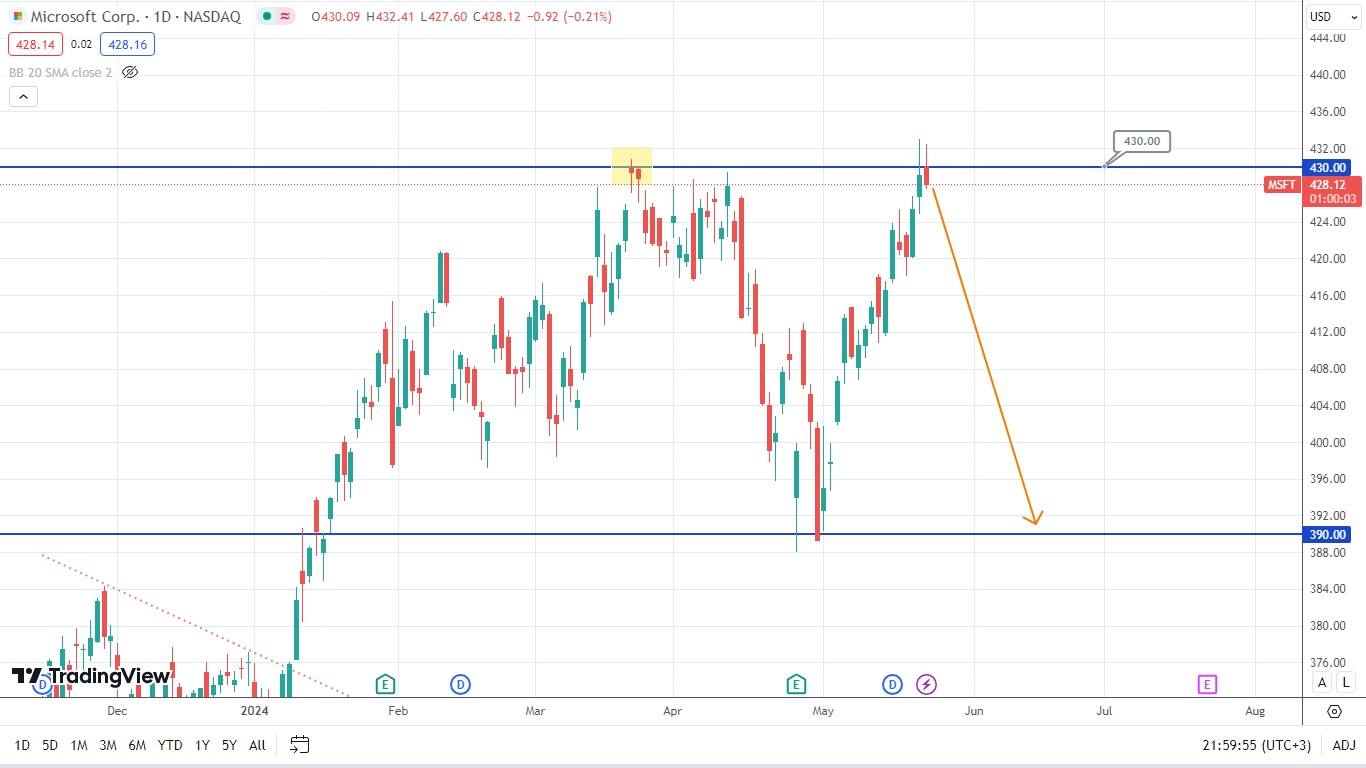
The price of Microsoft stocks has tested the resistance level of 430. Now, it is trying to form a shooting star, signifying the potential correction. This level is the highest historical price. Hence, the price of stocks might eventually undergo correction, drop, and gain the required support at the level of 390.
Disclaimer: The material provided is for information purposes only and should not be considered as investment advice. The views, information, or opinions expressed in the text belong solely to the author, and not to the author’s employer, organization, committee or other group or individual or company.
Past performance is not indicative of future results.
High Risk Warning: CFDs are complex instruments and come with a high risk of losing money rapidly due to leverage. 69% and 73% of retail investor accounts lose money when trading CFDs with Tickmill UK Ltd and Tickmill Europe Ltd respectively. You should consider whether you understand how CFDs work and whether you can afford to take the high risk of losing your money.
Futures and Options: Trading futures and options on margin carries a high degree of risk and may result in losses exceeding your initial investment. These products are not suitable for all investors. Ensure you fully understand the risks and take appropriate care to manage your risk.