Ethereum Forecast: Pullback and Price Drop Ahead
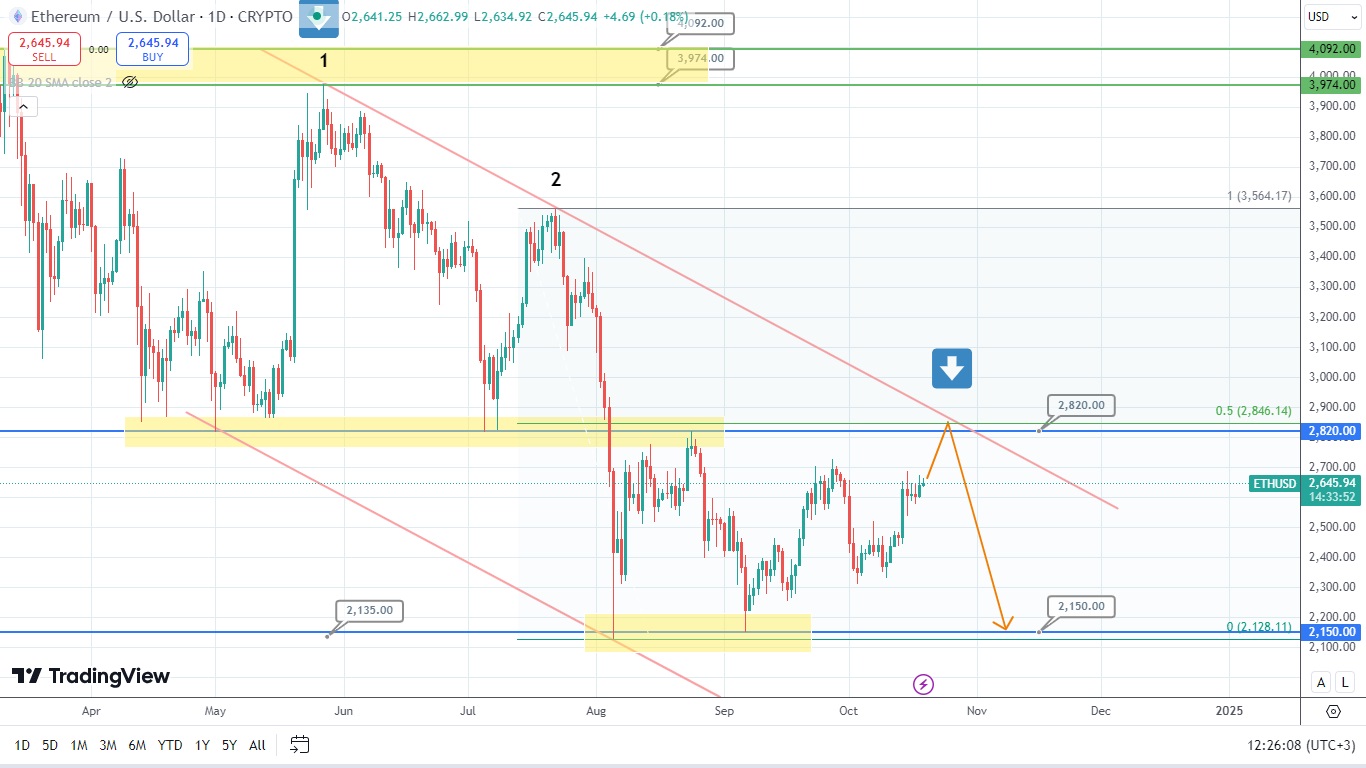
The price of Ethereum keeps moving in a wide range. Now, the price of this asset is approaching the upper boundary of the flat resistance level of 2820. At that, the resistance is located next to the downtrend and the middle point of the latest descending move, that is, the 50% Fibonacci retracement level. The asset is likely to reverse, rebound from the crossing point of these technical trendlines, and drop to the lower boundary of the price range, that is, the supporting level of 2150.

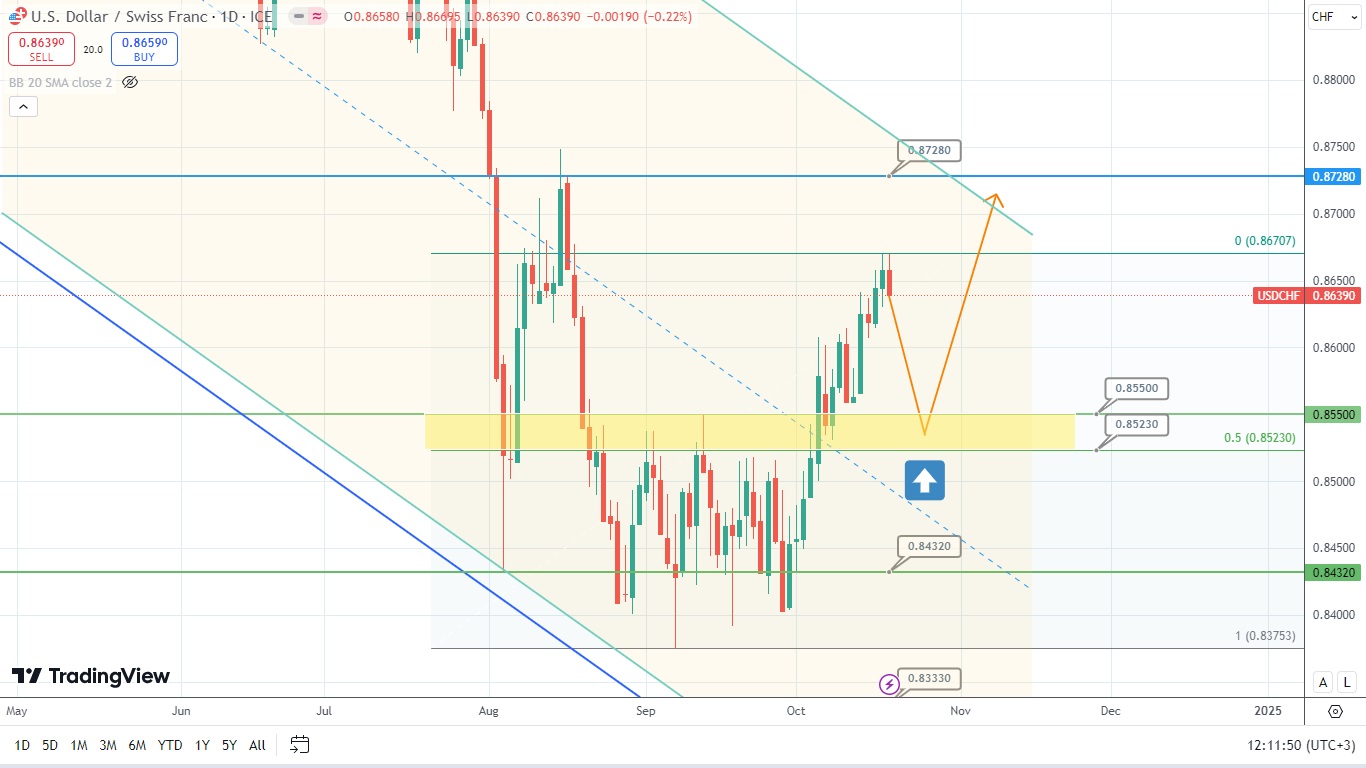
The price of the currency pair USD/CHF left the range and went up at the end of the trading week. Last Friday, the price of this asset formed an engulfing. Hence, it might undergo correction at the beginning of the upcoming trading week. In this case, the price of this currency pair could potentially drop and gain the required support in the zone formed between levels 0.8550 and 0.8523, that is, the upper boundary of the broken range. After that, it could rebound from this area and rise. Although the asset’s price is unlikely to be on the rise for a long time due to the immediate location of the downtrend right next to the level of 0.8700. Time will tell whether this scenario might work out.
The price of the currency pair CHF/JPY broke the resistance level of 172.80 and rebounded. However, it is currently testing this level and forming small candlestick patterns. This resistance also acts as a middle point of the latest descending move, that is, 50% Fibonacci retracement level. The price of this asset might potentially rebound from these levels and rise at the beginning of the next trading week. Should the price of this currency pair break the resistance and dive below the level of 174.40, it might rise and hit the level of 180 next. So, let’s observe what the next price movement of the currency pair CHF/JPY might be.

Disclaimer: The material provided is for information purposes only and should not be considered as investment advice. The views, information, or opinions expressed in the text belong solely to the author, and not to the author’s employer, organization, committee or other group or individual or company.
Past performance is not indicative of future results.
High Risk Warning: CFDs are complex instruments and come with a high risk of losing money rapidly due to leverage. 69% and 73% of retail investor accounts lose money when trading CFDs with Tickmill UK Ltd and Tickmill Europe Ltd respectively. You should consider whether you understand how CFDs work and whether you can afford to take the high risk of losing your money.
Futures and Options: Trading futures and options on margin carries a high degree of risk and may result in losses exceeding your initial investment. These products are not suitable for all investors. Ensure you fully understand the risks and take appropriate care to manage your risk.