Daily Market Outlook, March 19, 2020
Daily Market Outlook, March 19, 2020
The Global market sold off continued yesterday as investors dumped stocks, bonds and even gold in favour of cash as pandemic fear engulfed markets.
US main indexes plunged around 4.7-6.3% just one day after a sharp rebound; the Dow Jones lost 1338pts DOD in a nerve-wracking day that marked the blue chip index first closing below 20,000 since Feb-17.
Massive sell-off was seen across Asian and European equities as well as other asset classes. Traditional safe havens suffered the same fate with gold falling below $1500/ounce and Treasury yields closed higher by 5-28bps; 10Y UST yield recovered further to 1.12%.
Dollar soared across the board and boosted the Dollar Index above 100 to a multi-year high of 101.16.
Crude oil prices continued to free fall to their lowest levels since Feb 2016, with Brent settling 13% lower at $24.88/barrel and WTI collapsing to $20.37/barrel.
The US Senate has passed a bill allowing paid sick leave and free testing of Covid-19. The ECB announced an emergency QE program worth €750b coined as the pandemic emergency purchase program (PEPP) that would see the central bank purchase private and public sector securities. This would be added on top of the €120b “envelope” announced just last week after the Governing Council meeting as well as the ongoing €20b monthly purchases (started last October).
Weaker US housing data: US housing starts slipped 1.5% MOM to an annual rate of 1.6mil units in February following an upward revised 1.4% growth. Gain in building permits eased to 5.5% MOM (Jan: +9.2%) at 1.5mil unit annual pace, pointing to slower/subdued homebuilding activities ahead of the Covid-19 spread in the US. Mortgage applications slipped 8.4% WOW last week following an enormous 55% jump. Lower interest rates following the Fed’s two emergency rate cuts are set to drag down borrowing costs lower that would help buoy the housing market but the coronavirus pandemic that has only worsened in the US in March is likely to disrupt the sector’s gradual recovery this month onwards.
Eurozone inflation eased in Feb prior to Covid-19 escalation: The HICP inflation rate went down to 1.2% YOY in February (Jan: +1.4%), dragged down by lower energy cost (-0.3% vs +1.9%). Services inflation rose modestly by 1.6% YOY (Jan: +1.5%) and was the largest positive contributor among other components which explains the slight pick-up in underlying inflation (+1.2% vs +1.1%). Overall inflation remains subdued in the Euro area prior to the escalation Covid-19 outbreak in the region that saw cases surging in Italy, Germany and France within weeks. The resulting fall in demand amid lockdowns and other strict containment measures alongside falling global oil prices are set to weigh on inflation further in the short to medium term.
Smaller Eurozone trade surplus: The seasonally adjusted trade surplus narrowed to €17.3b in January (Dec: €21.5b revised), reflecting the 2.5% MOM increase in imports and a nearly unchanged exports (+0.1%) at the start of the year. Japan inflation lost momentum: Japan headline CPI inflation eased tremendously to 0.4% YOY in February (Jan: +0.7%) on the back of lower energy prices. Gain in the core CPI which excludes food prices, a BOJ’s preferred measure of inflation also eased to 0.6% YOY (Jan: +0.8%). Excluding food and energy, inflation also fell to 0.7% YOY (Jan: +0.8%), adding to signs that price pressure has lost momentum, despite a recent hike in sales tax. Inflation is expected to trend even lower in the months to come on the back of falling global oil prices and weak domestic demand stemming from Covid-19 pandemic.
Australia added more jobs prior to Covid-19: The Australian economy added 26.7k jobs in February (Jan: +13.5k), more than what economists had predicted earlier (+6.3k). Gains came mainly from part-time employment (+20.0k vs -32.7k) while full-time jobs increased by 6.7k following a 46.2k jump in Jan. Unemployment rate also beat expectations at a much lower 5.1% (Jan: 5.3%) thanks to lower participation rate (66% vs 66.1%). The number of job creations is set to tumble this month as the Covid-19 outbreak disrupted the services sector and stifled hiring.
Today’s Options Expiries for 10AM New York Cut (notable size in bold)
- EURUSD: 1.0825 (2.3BLN), 1.0870-75 (450M), 1.0900 (500M), 1.0930-35 (700M) 1.0950-55 (500M), 1.1000 (340M), 1.1030-35 (1BLN)
- USDJPY: 108.25 (1.2BLN)
Technical & Trade Views
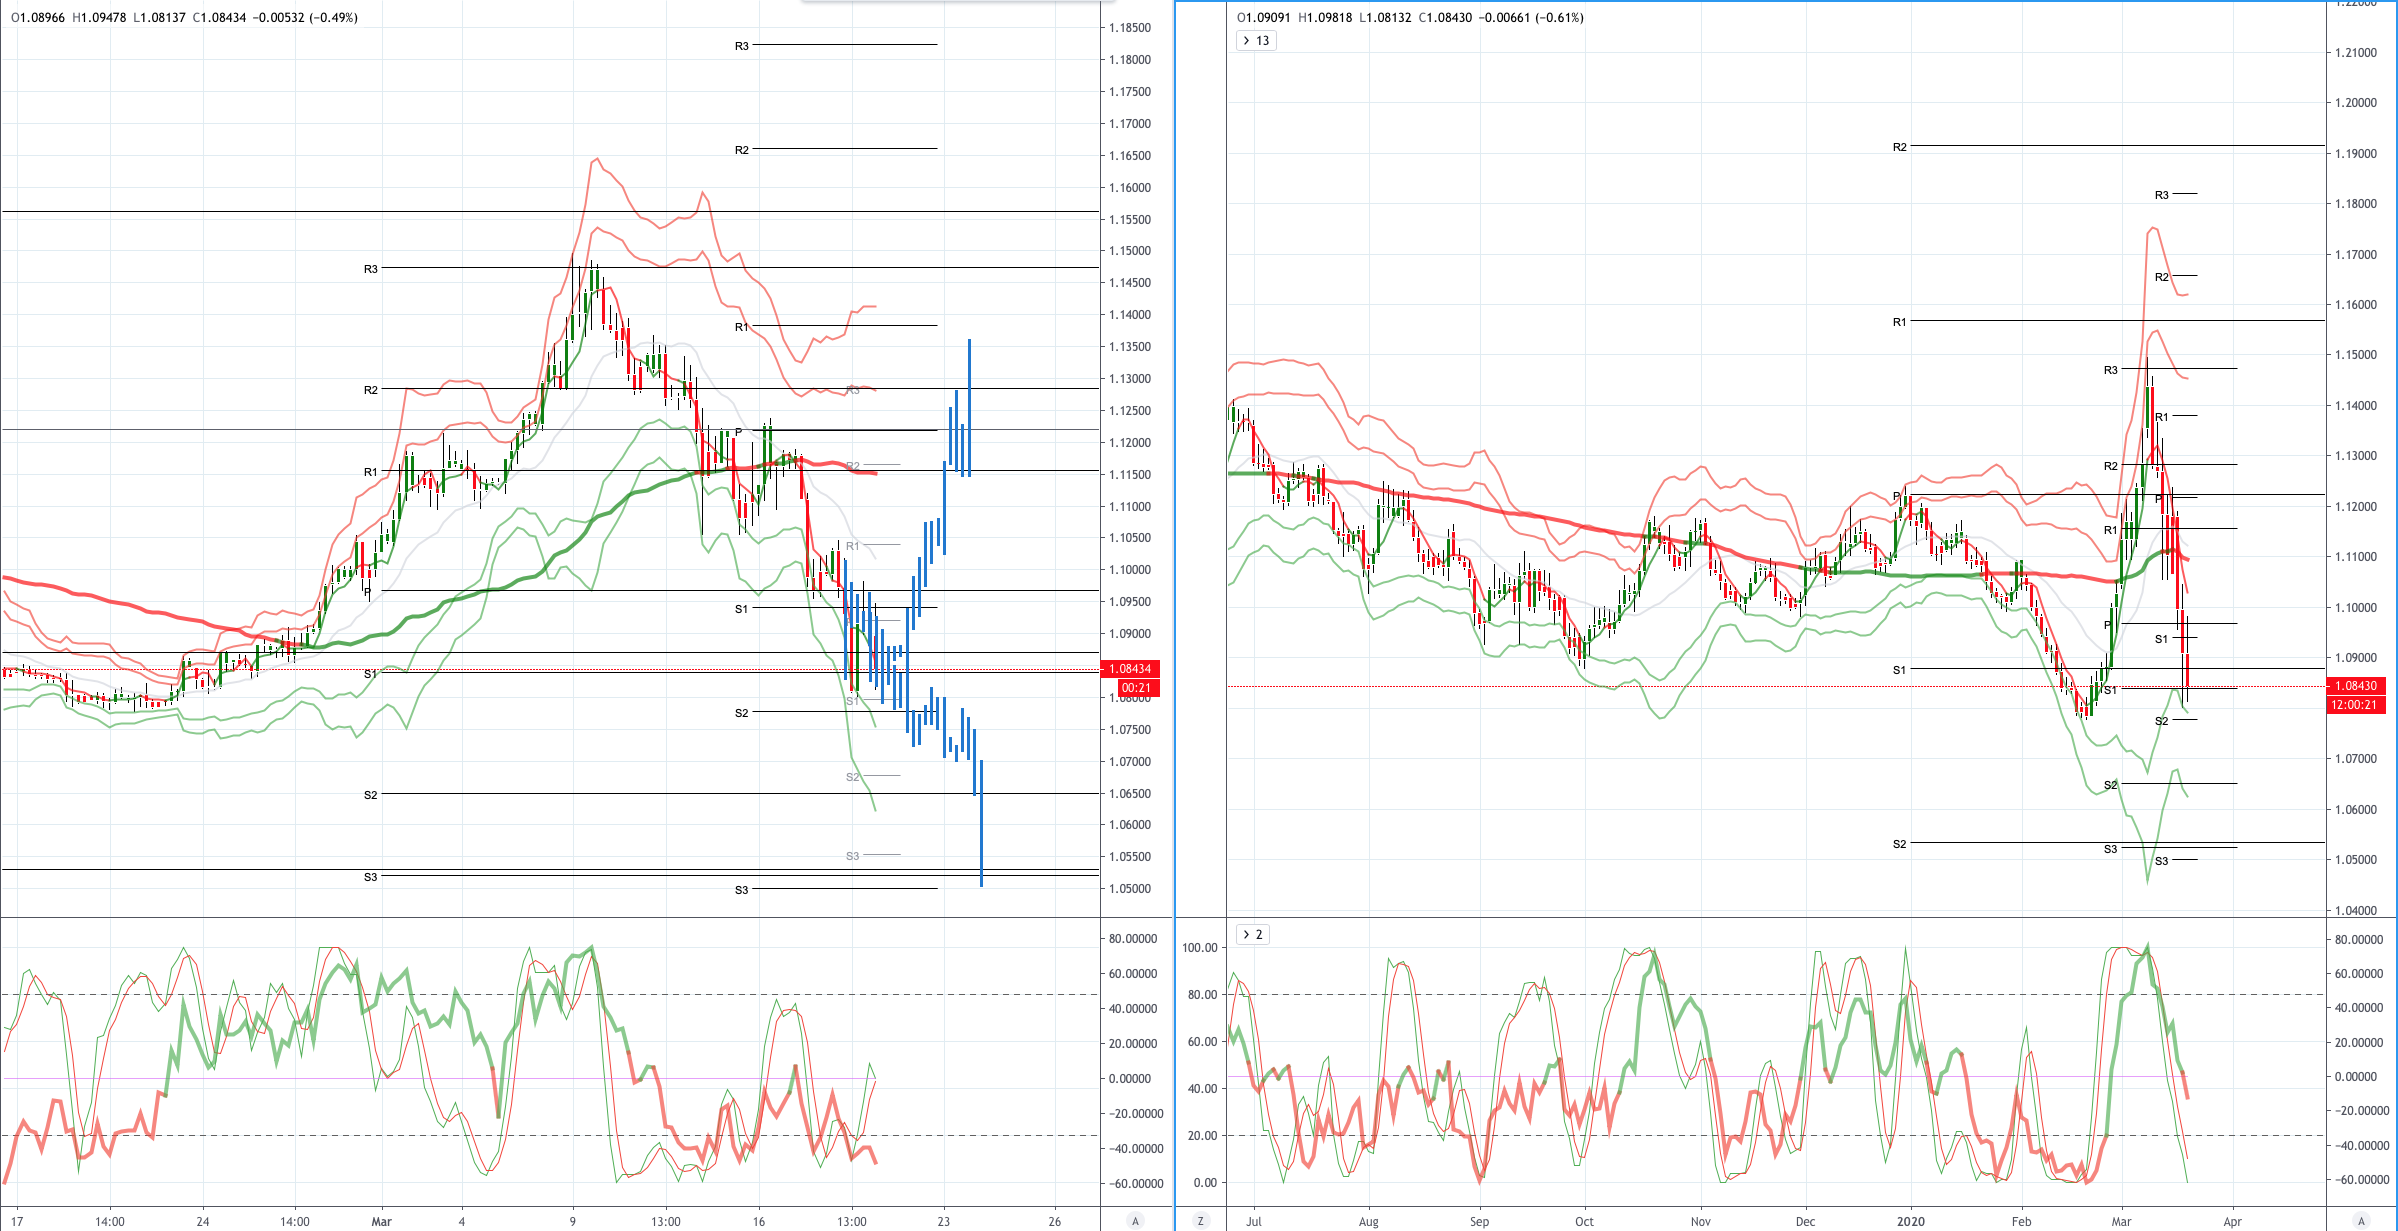
EURUSD (Intraday bias: Bearish below 1.1030 Bullish above)
EURUSD From a technical and trading perspective, while price struggles to reclaim 1.12 it appears a test of the pivotal 1.0950 may be underway. A failure to find support here will see a quick retest of Year To Date (YTD) lows. A close above 1.12 still needs to get constructive on the pair again. UPDATE do or die for EURUSD bulls, if we lose 1.08 support look for a quick test of 1.0500/50 as the next downside objective. On the day only a close back through 1.1030 would suggest a delay in downside objectives
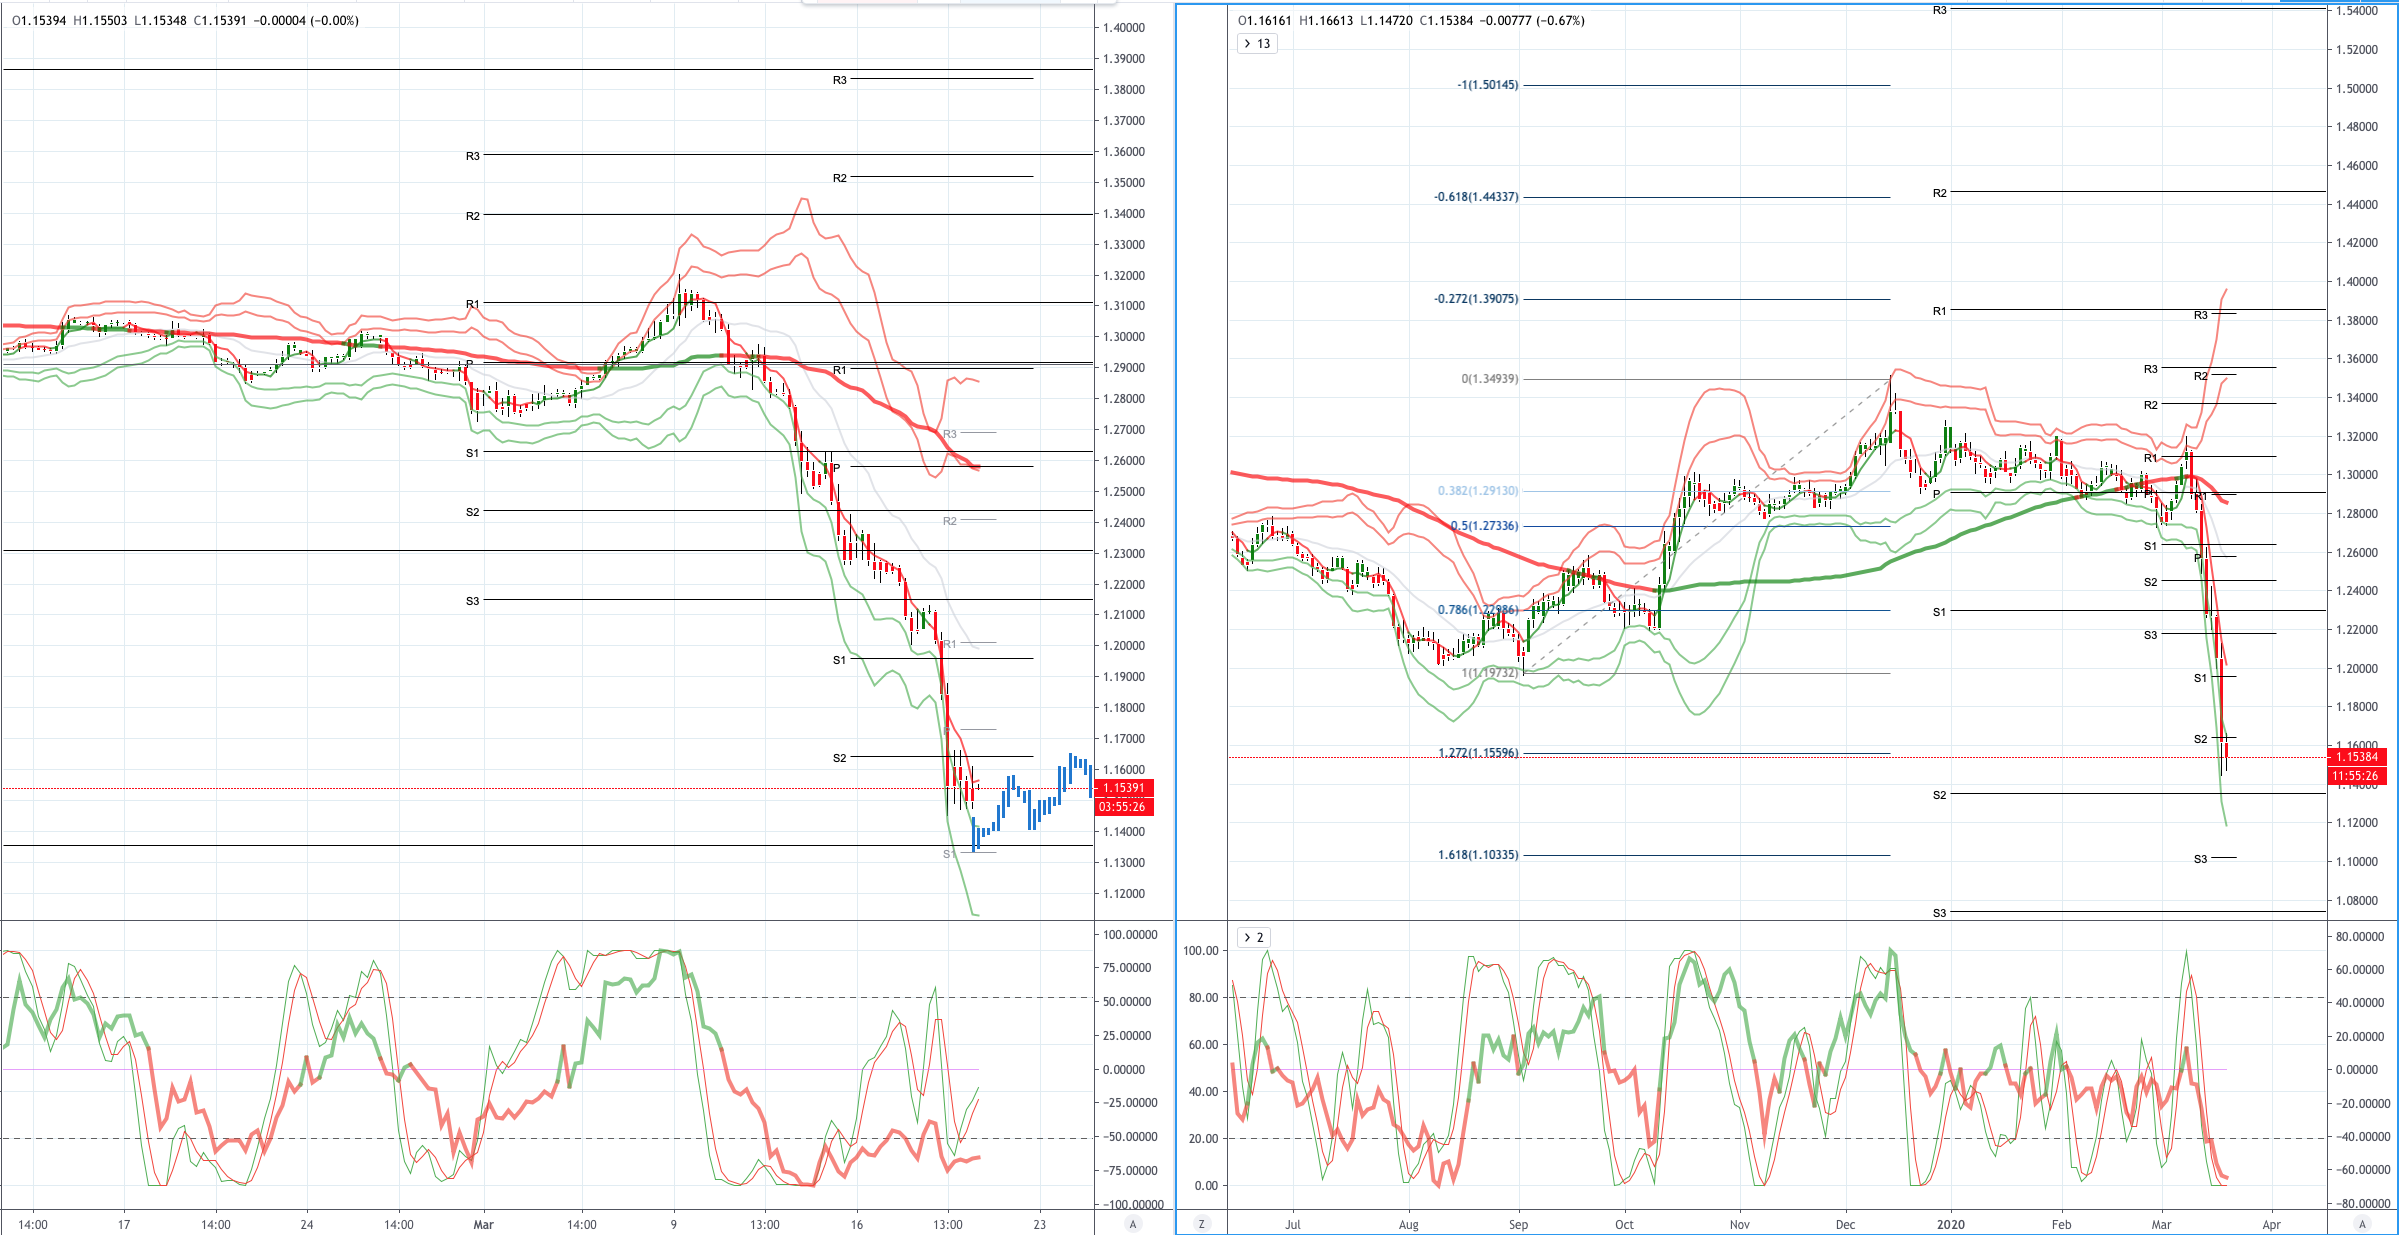
GBPUSD (Intraday bias: Bearish below 1.21)
GBPUSD From a technical and trading perspective, the inverse head and shoulders scenario discussed in last week's Weekly Market Outlook appears to be negated, unless price can stage an impressive key reversal pattern today closing above Friday’s highs then it appears price looks poised to make a rund to test bids and stops below 1.20 the pivot cluster and 2019 lows towards 1.1950. UPDATE 1.1950 offered little in the way of support as liquidity evaporated on fears of a London lockdown. It seems premature to talk about a double bottom but a defense of 1.1475 could be significant, a failure to defend this level would suggest further declines to test the psychological 1.10 level
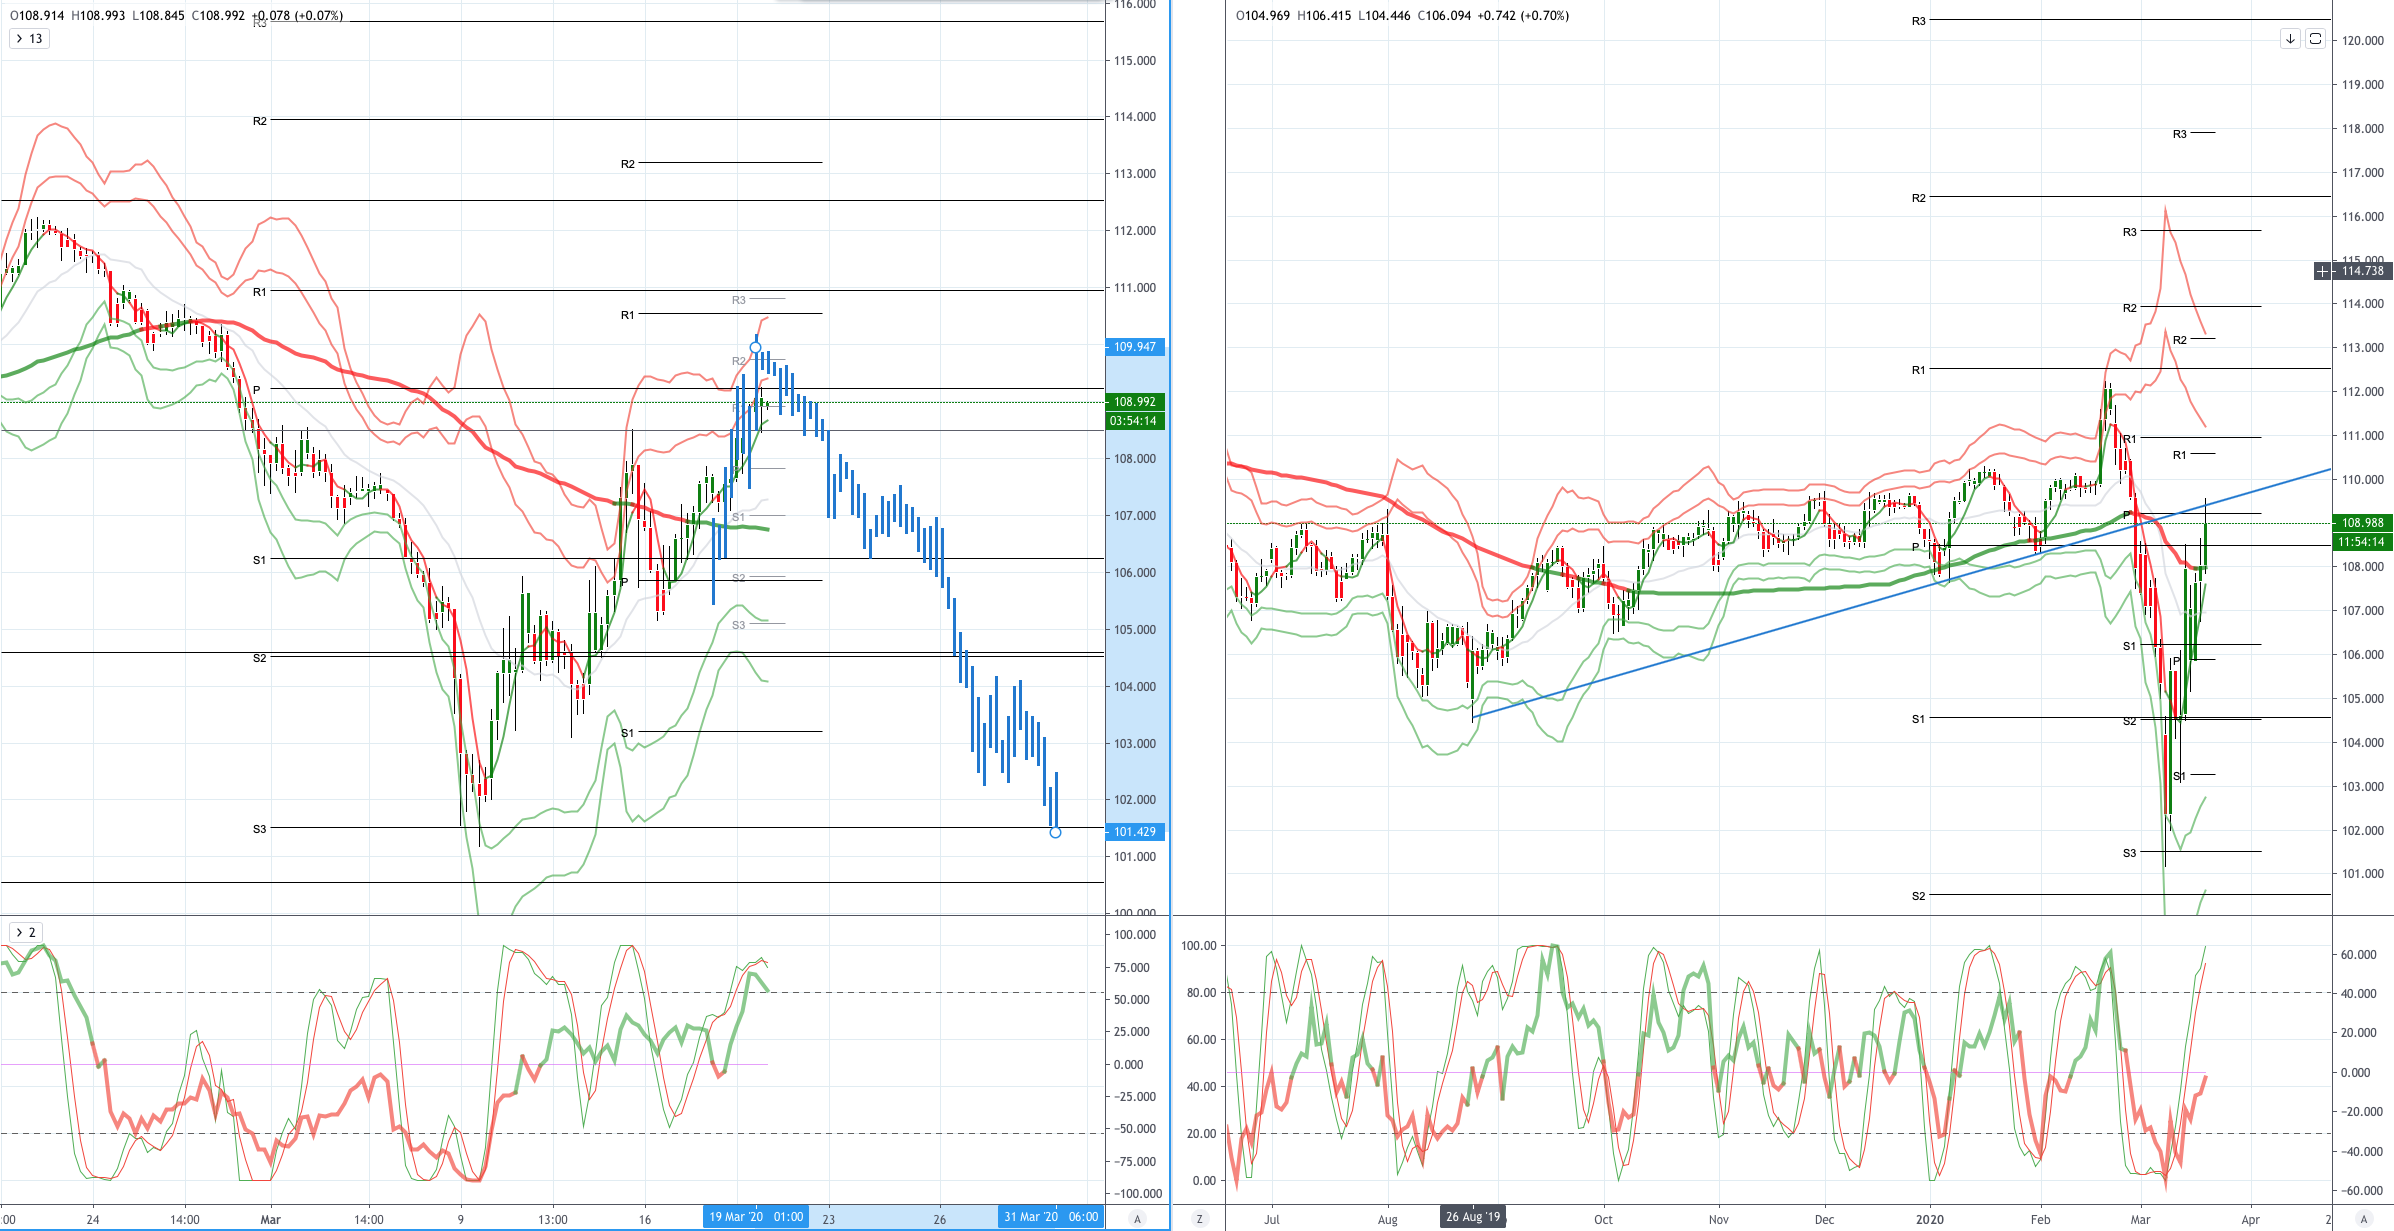
USDJPY (intraday bias: Bearish below 109.50 Bullish above)
USDJPY From a technical and trading perspective, anticipated upside correction extends to test the equidistant swing objective sighted at 107.96, as 108.50/109 prior trend line support no acts as resistance there is a window for another leg lower to develop to retest prior swing lows a close sub 106 will flip the daily chart bearish again as per the near term VWAP
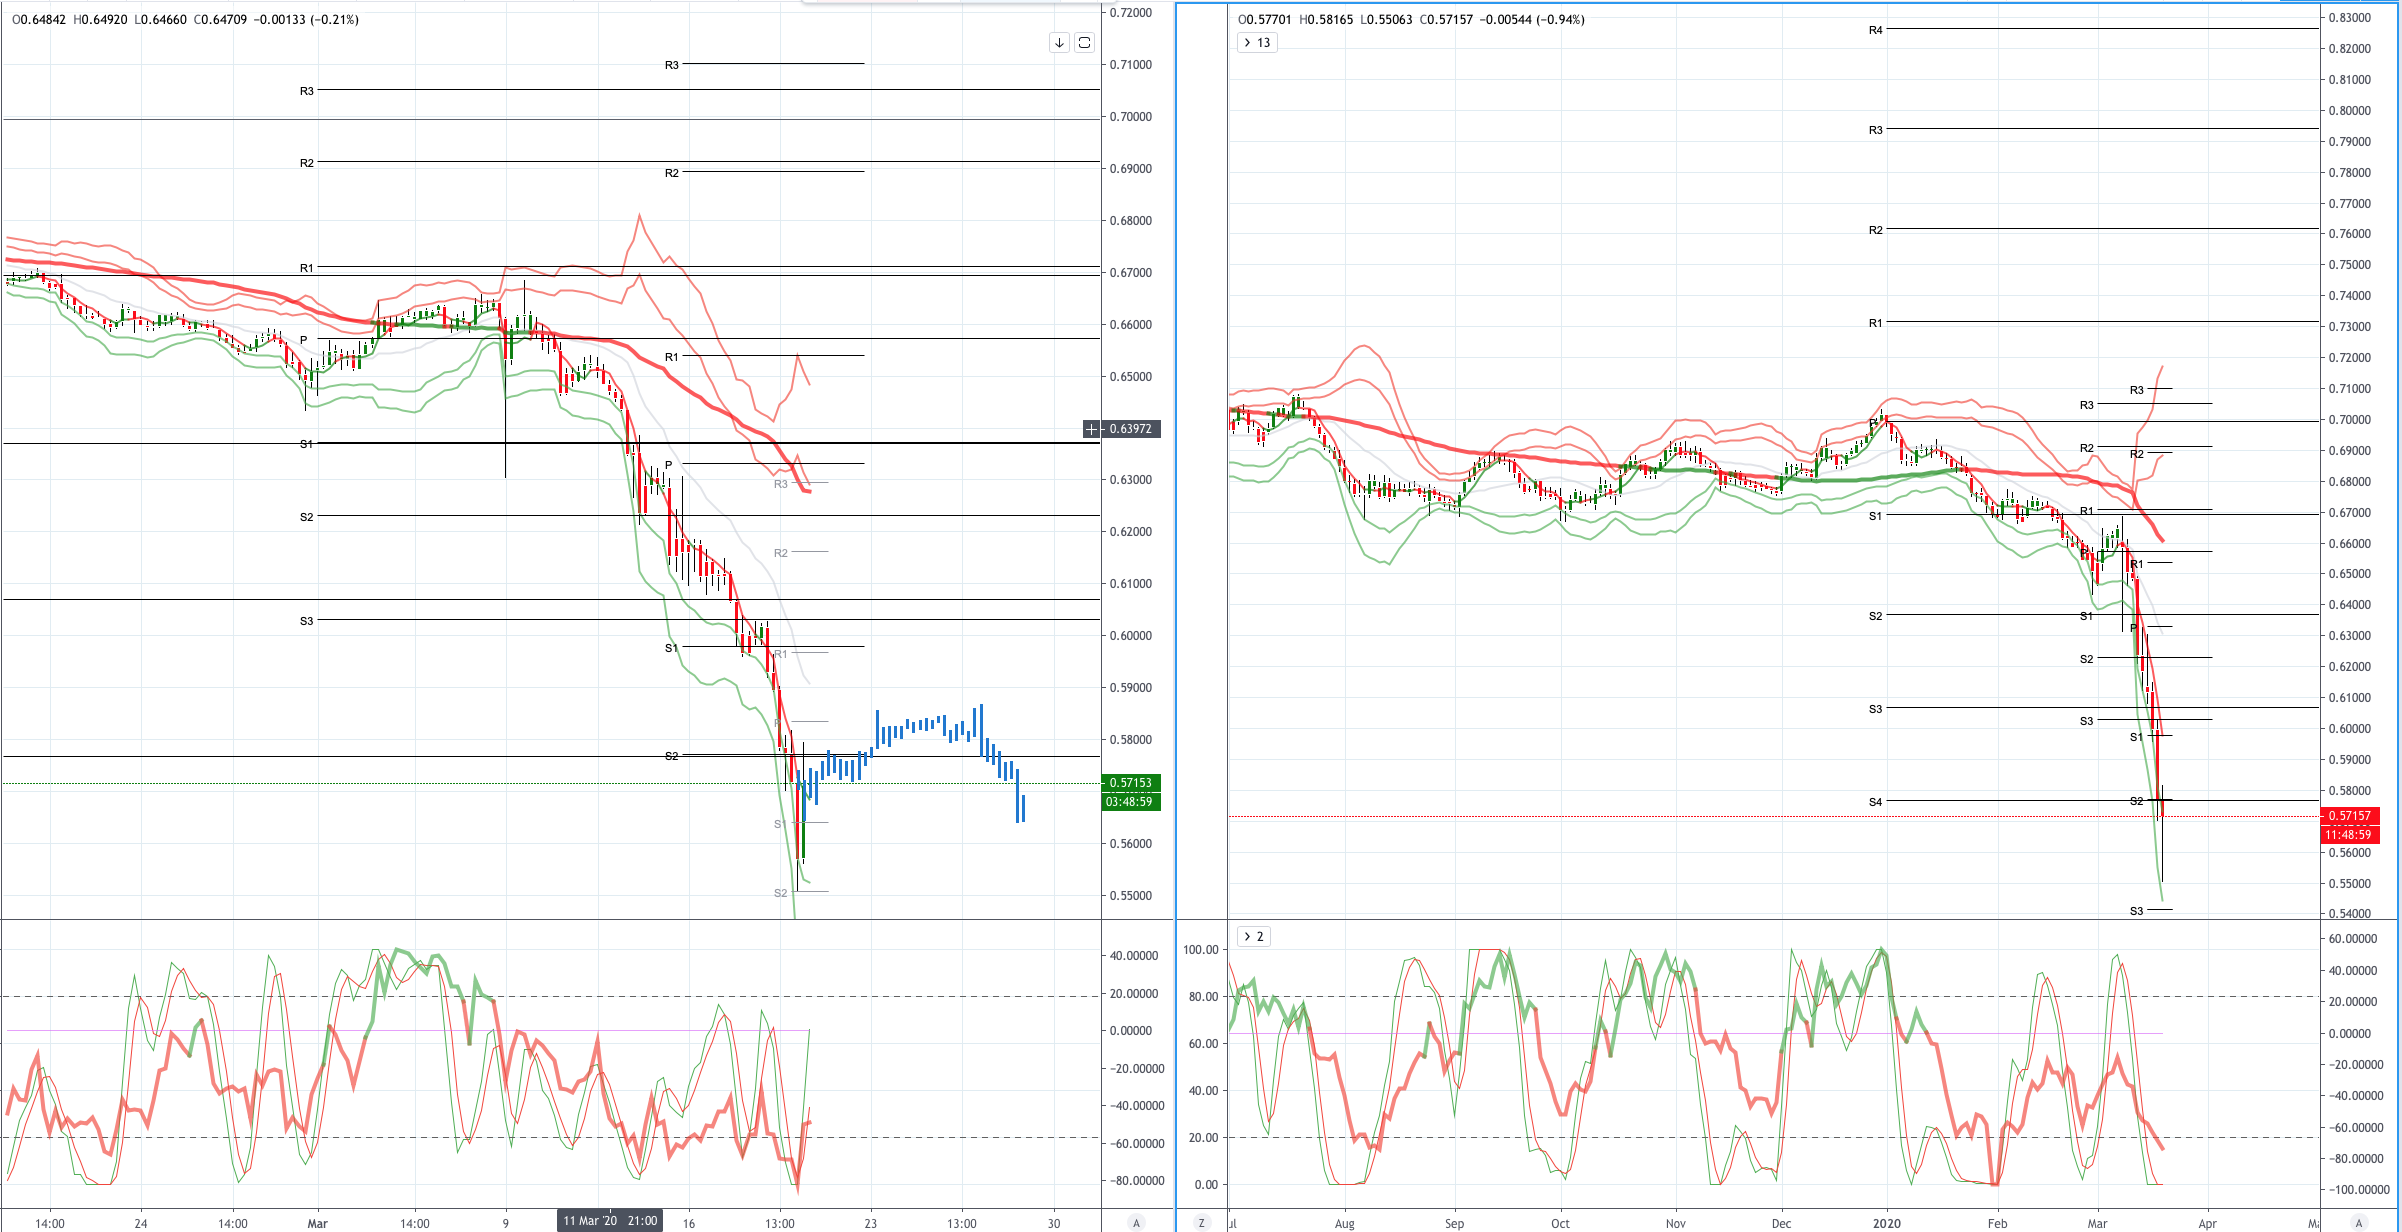
AUDUSD (Intraday bias: Bearish below .5800 Bullish above)
AUDUSD From a technical and trading perspective as .6300 contains upside attempts look for a test towards the support cluster towards the psychological .6000 level (equidistant swing and pivot cluster) UPDATE .6000 test underway a failure to produce a bullish reversal pattern here will see further losses to the next cluster magnet sub .5800 UPDATE .5800 erased yesterday .5500 has produced some near term demand, however until .6000 is reclaimed on a sustained basis it is difficult to get constructive on the paint and .5000 could well be tested
Disclaimer: The material provided is for information purposes only and should not be considered as investment advice. The views, information, or opinions expressed in the text belong solely to the author, and not to the author’s employer, organization, committee or other group or individual or company.
High Risk Warning: CFDs are complex instruments and come with a high risk of losing money rapidly due to leverage. 73% and 70% of retail investor accounts lose money when trading CFDs with Tickmill UK Ltd and Tickmill Europe Ltd respectively. You should consider whether you understand how CFDs work and whether you can afford to take the high risk of losing your money.
Disclaimer: The material provided is for information purposes only and should not be considered as investment advice. The views, information, or opinions expressed in the text belong solely to the author, and not to the author’s employer, organization, committee or other group or individual or company.
Past performance is not indicative of future results.
High Risk Warning: CFDs are complex instruments and come with a high risk of losing money rapidly due to leverage. 71% and 74% of retail investor accounts lose money when trading CFDs with Tickmill UK Ltd and Tickmill Europe Ltd respectively. You should consider whether you understand how CFDs work and whether you can afford to take the high risk of losing your money.
Futures and Options: Trading futures and options on margin carries a high degree of risk and may result in losses exceeding your initial investment. These products are not suitable for all investors. Ensure you fully understand the risks and take appropriate care to manage your risk.
Patrick has been involved in the financial markets for well over a decade as a self-educated professional trader and money manager. Flitting between the roles of market commentator, analyst and mentor, Patrick has improved the technical skills and psychological stance of literally hundreds of traders – coaching them to become savvy market operators!