Chart of The Day, Crude

Chart of The Day Crude Oil
Crude Oil Probable Price Path & Potential Reversal Zone
US stocks rallied yesterday, driven by upbeat retail sales data that matched economists’ estimates alongside stronger than expected Morgan Stanley earnings, just one day after the United States and China signed the Phase One trade deal. Gains were broad based and were led by the tech sector that prompted the S&P500 index (+0.8%) to breach 3,300 for the first time. The Dow Jones Industrial Average (+0.9%) and NASDAQ (+1.1%) also jumped to new highs. US bonds yields picked up by 1-3bps. Gold prices retreated to $1552.51/troy ounce, crude oils gained around 1% on trade optimism; Brent crude settled at $64.62/barrel.
US data was upbeat in general. Retail sales matched consensus forecast to print a 0.3% MOM growth in December. Initial jobless claims slipped to 204k, its lowest in six weeks. The Philly Fed Manufacturing Index jumped by nearly 15pts this month while the NAHB Housing Market Index remained at elevated level. Imported prices index rebounded to notch a 0.5% YOY gain in December, its first positive reading in nine months. Meanwhile in the UK, the RICS house price balance index jumped to -2.2% in December after the general election. Australia housing data were also encouraging as total home loan approval values climbed 1.8% MOM, supported by investor lending. Last but not least, the Business NZ Performance of Manufacturing PMI slumped back to contraction area at 49.3 in December, suggesting that factories are still struggling in New Zealand.
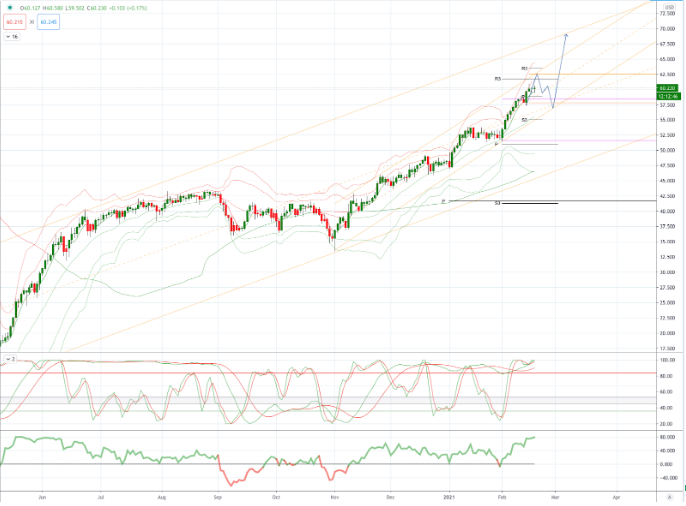
From a technical and trading perspective, Crude oil has been benefiting from the reflation trade trend, the current advance looks poised to test the projected interim ascending trend channel resistance sited at 62.60 this level also represents projected weekly range resistance. Counter trend players will be watching for bearish reversal patterns here to set short positions, looking for a three wave corrective swing to ideally test the the confluent interim ascending trendline support and the median line of the primary trend channel at 57.50, watch for bullish reversal pattern here to reposition on the long side aligning with the broader trend targeting a move towards 70.00
Disclaimer: The material provided is for information purposes only and should not be considered as investment advice. The views, information, or opinions expressed in the text belong solely to the author, and not to the author’s employer, organization, committee or other group or individual or company.
High Risk Warning: CFDs are complex instruments and come with a high risk of losing money rapidly due to leverage. 75% and 65% of retail investor accounts lose money when trading CFDs with Tickmill UK Ltd and Tickmill Europe Ltd respectively. You should consider whether you understand how CFDs work and whether you can afford to take the high risk of losing your money.
Disclaimer: The material provided is for information purposes only and should not be considered as investment advice. The views, information, or opinions expressed in the text belong solely to the author, and not to the author’s employer, organization, committee or other group or individual or company.
Past performance is not indicative of future results.
High Risk Warning: CFDs are complex instruments and come with a high risk of losing money rapidly due to leverage. 69% and 73% of retail investor accounts lose money when trading CFDs with Tickmill UK Ltd and Tickmill Europe Ltd respectively. You should consider whether you understand how CFDs work and whether you can afford to take the high risk of losing your money.
Futures and Options: Trading futures and options on margin carries a high degree of risk and may result in losses exceeding your initial investment. These products are not suitable for all investors. Ensure you fully understand the risks and take appropriate care to manage your risk.
Patrick has been involved in the financial markets for well over a decade as a self-educated professional trader and money manager. Flitting between the roles of market commentator, analyst and mentor, Patrick has improved the technical skills and psychological stance of literally hundreds of traders – coaching them to become savvy market operators!