Bitcoin Forecast: Potential Price Rise Ahead

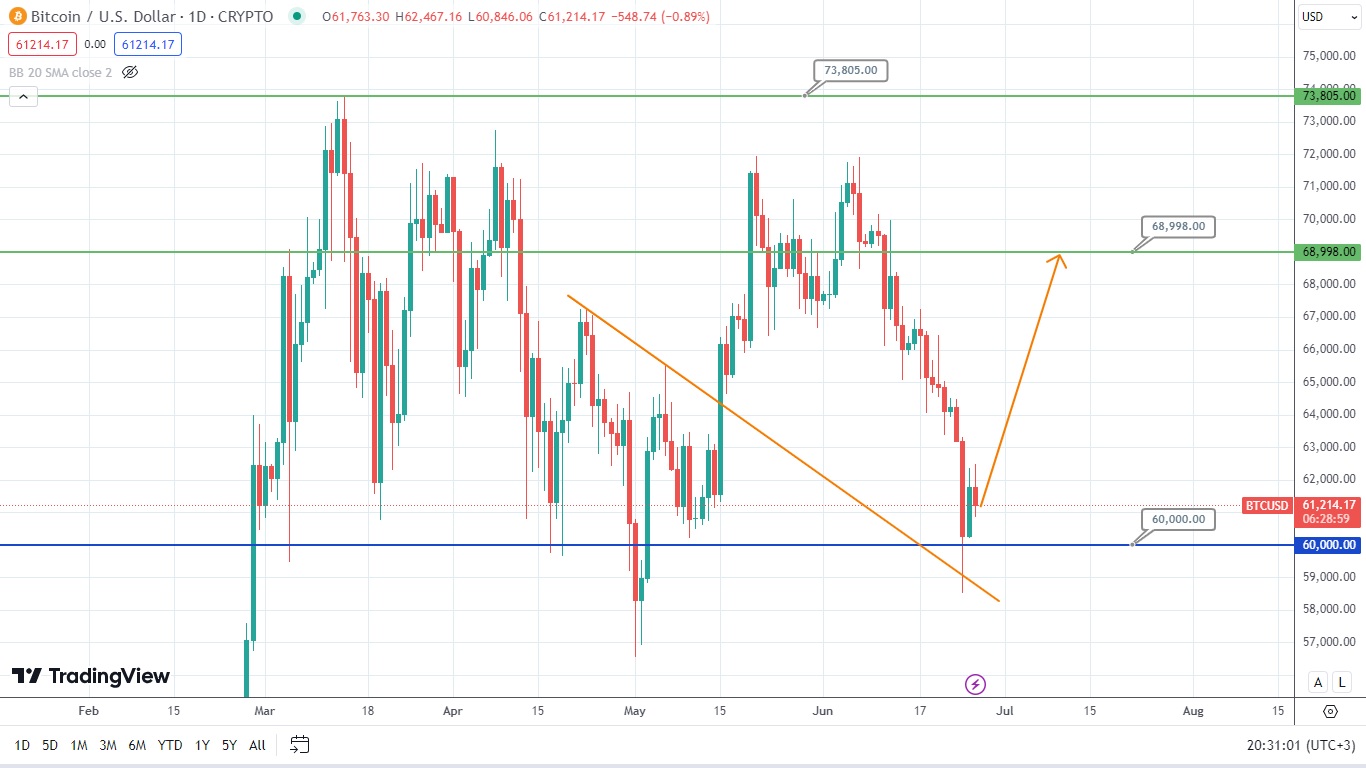
The price of Bitcoin tested the psychological support level of 60000 and formed the piercing line at the end of the trading day. This level also acts as a bearish trap, and the price of Bitcoin keeps testing it. Hence, the price of Bitcoin might potentially rise and target a very important resistance level of 68998. So, let’s see what the next price movement of this asset might be.
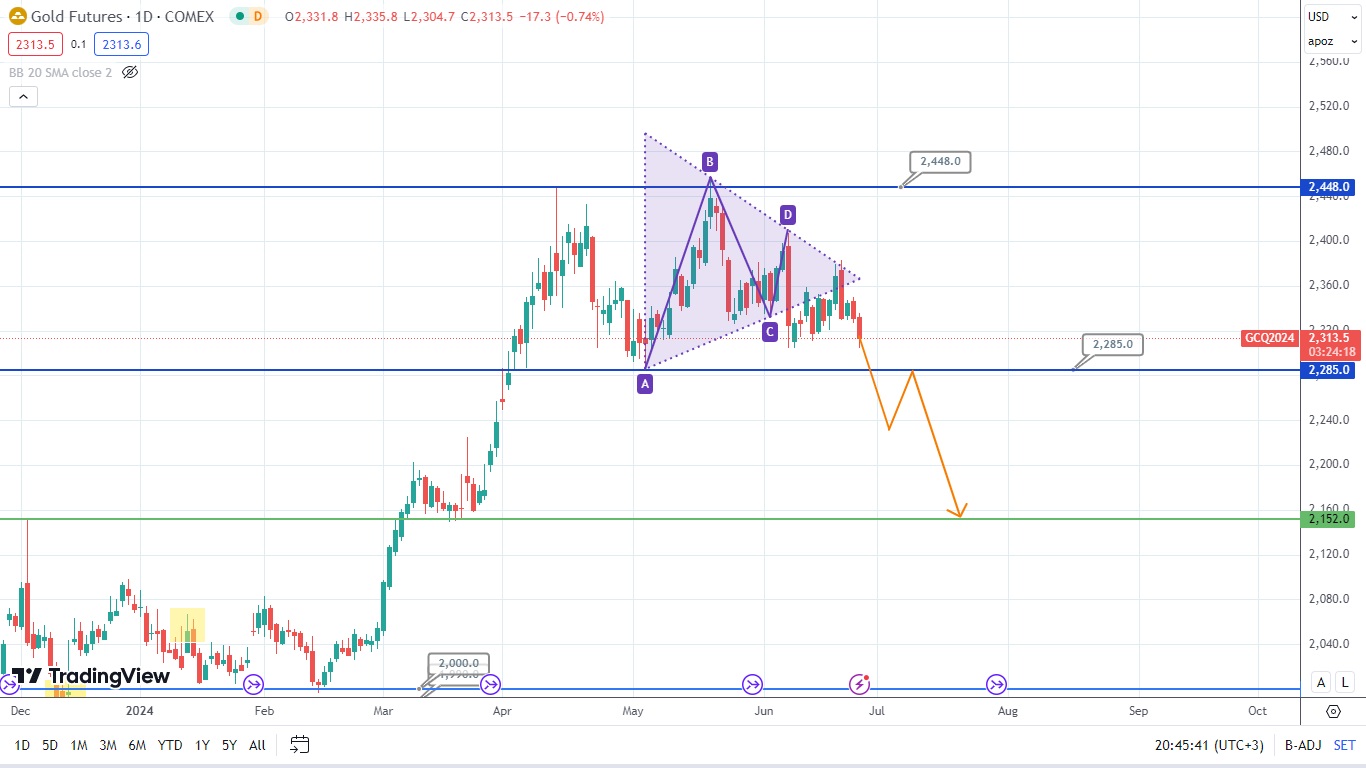
The price of gold broke the lower side of the symmetrical triangle and tested its broken side. The price of this asset is likely to drop soon. However, it should break the supporting level of 2285 first and then only target the level of 2152. Time will tell whether this scenario might work out.
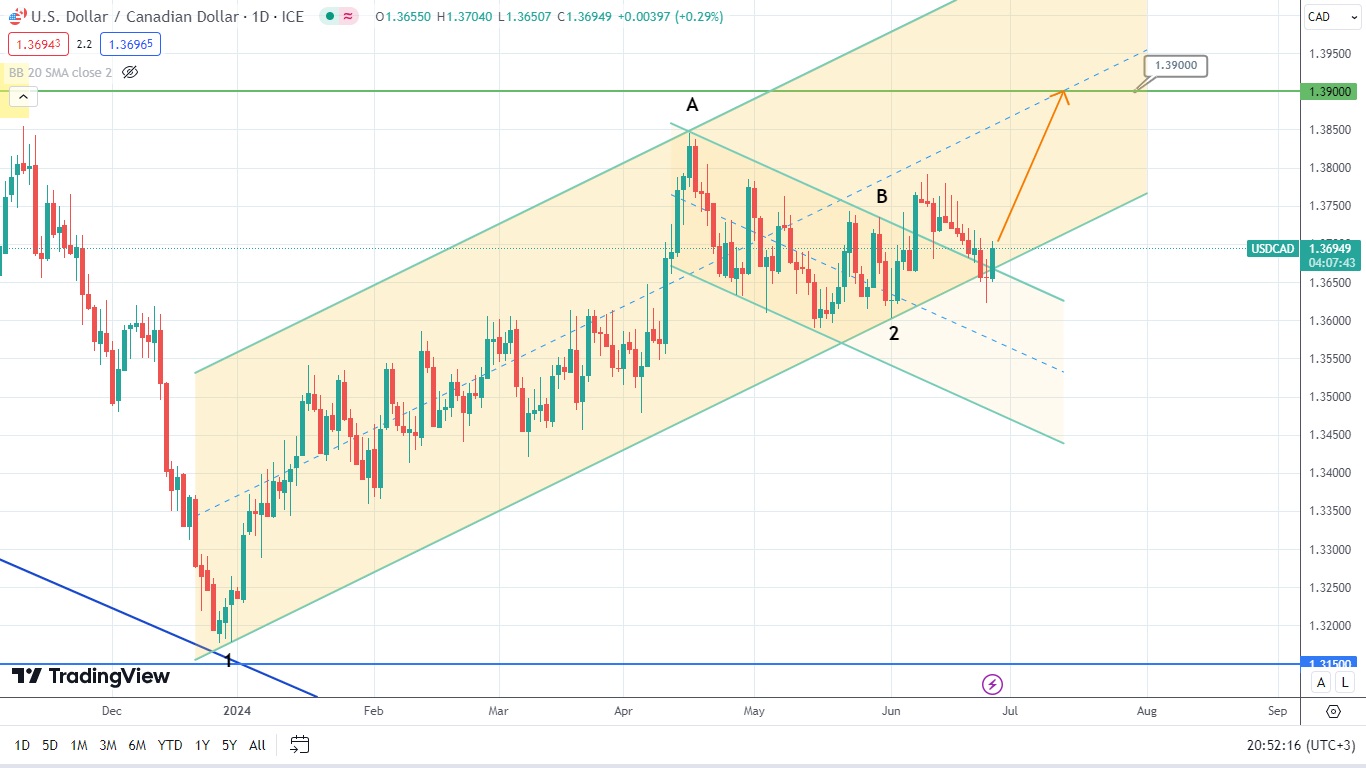
The price of the currency pair USD/CAD rebounded from the crossing point of the uptrend drawn at points 1 and 2, and the broken local downtrend formed between the points А and В. Now, this downtrend acts as a bullish flag. The price of this asset tried to form a white candle at the end of the trading day. So, it might potentially rise and face resistance at the level of 1.3900 at the end of the trading week. So, let’s observe what might happen next.
Disclaimer: The material provided is for information purposes only and should not be considered as investment advice. The views, information, or opinions expressed in the text belong solely to the author, and not to the author’s employer, organization, committee or other group or individual or company.
Past performance is not indicative of future results.
High Risk Warning: CFDs are complex instruments and come with a high risk of losing money rapidly due to leverage. 69% and 73% of retail investor accounts lose money when trading CFDs with Tickmill UK Ltd and Tickmill Europe Ltd respectively. You should consider whether you understand how CFDs work and whether you can afford to take the high risk of losing your money.
Futures and Options: Trading futures and options on margin carries a high degree of risk and may result in losses exceeding your initial investment. These products are not suitable for all investors. Ensure you fully understand the risks and take appropriate care to manage your risk.