Chart of the Day Bullish AUDCAD

Chart of the Day Bullish AUDCAD
Bullish AUDCAD - AUD: Australia Leading Index points to weak economic momentum: The Westpac-Melbourne Institute Leading Index edged lower by 0.07% in October (Sep: -0.12% revised) leading the six-month annualized growth rate at a slightly better -0.91% (Sep: -1.01%), materially below trend and continues to point to weak economic momentum heading into 2020.
CAD: Canada manufacturing sales declined less than expected. Instead, the Loonie was under pressure on comments from Bank of Canada Wilkins. The central banker said the BoC 'still had room to maneuver with interest rates 'at 1.75%, trade policy ‘uncertainty remained high,' and lower oil prices 'continued to weigh on energy-producing provinces.'

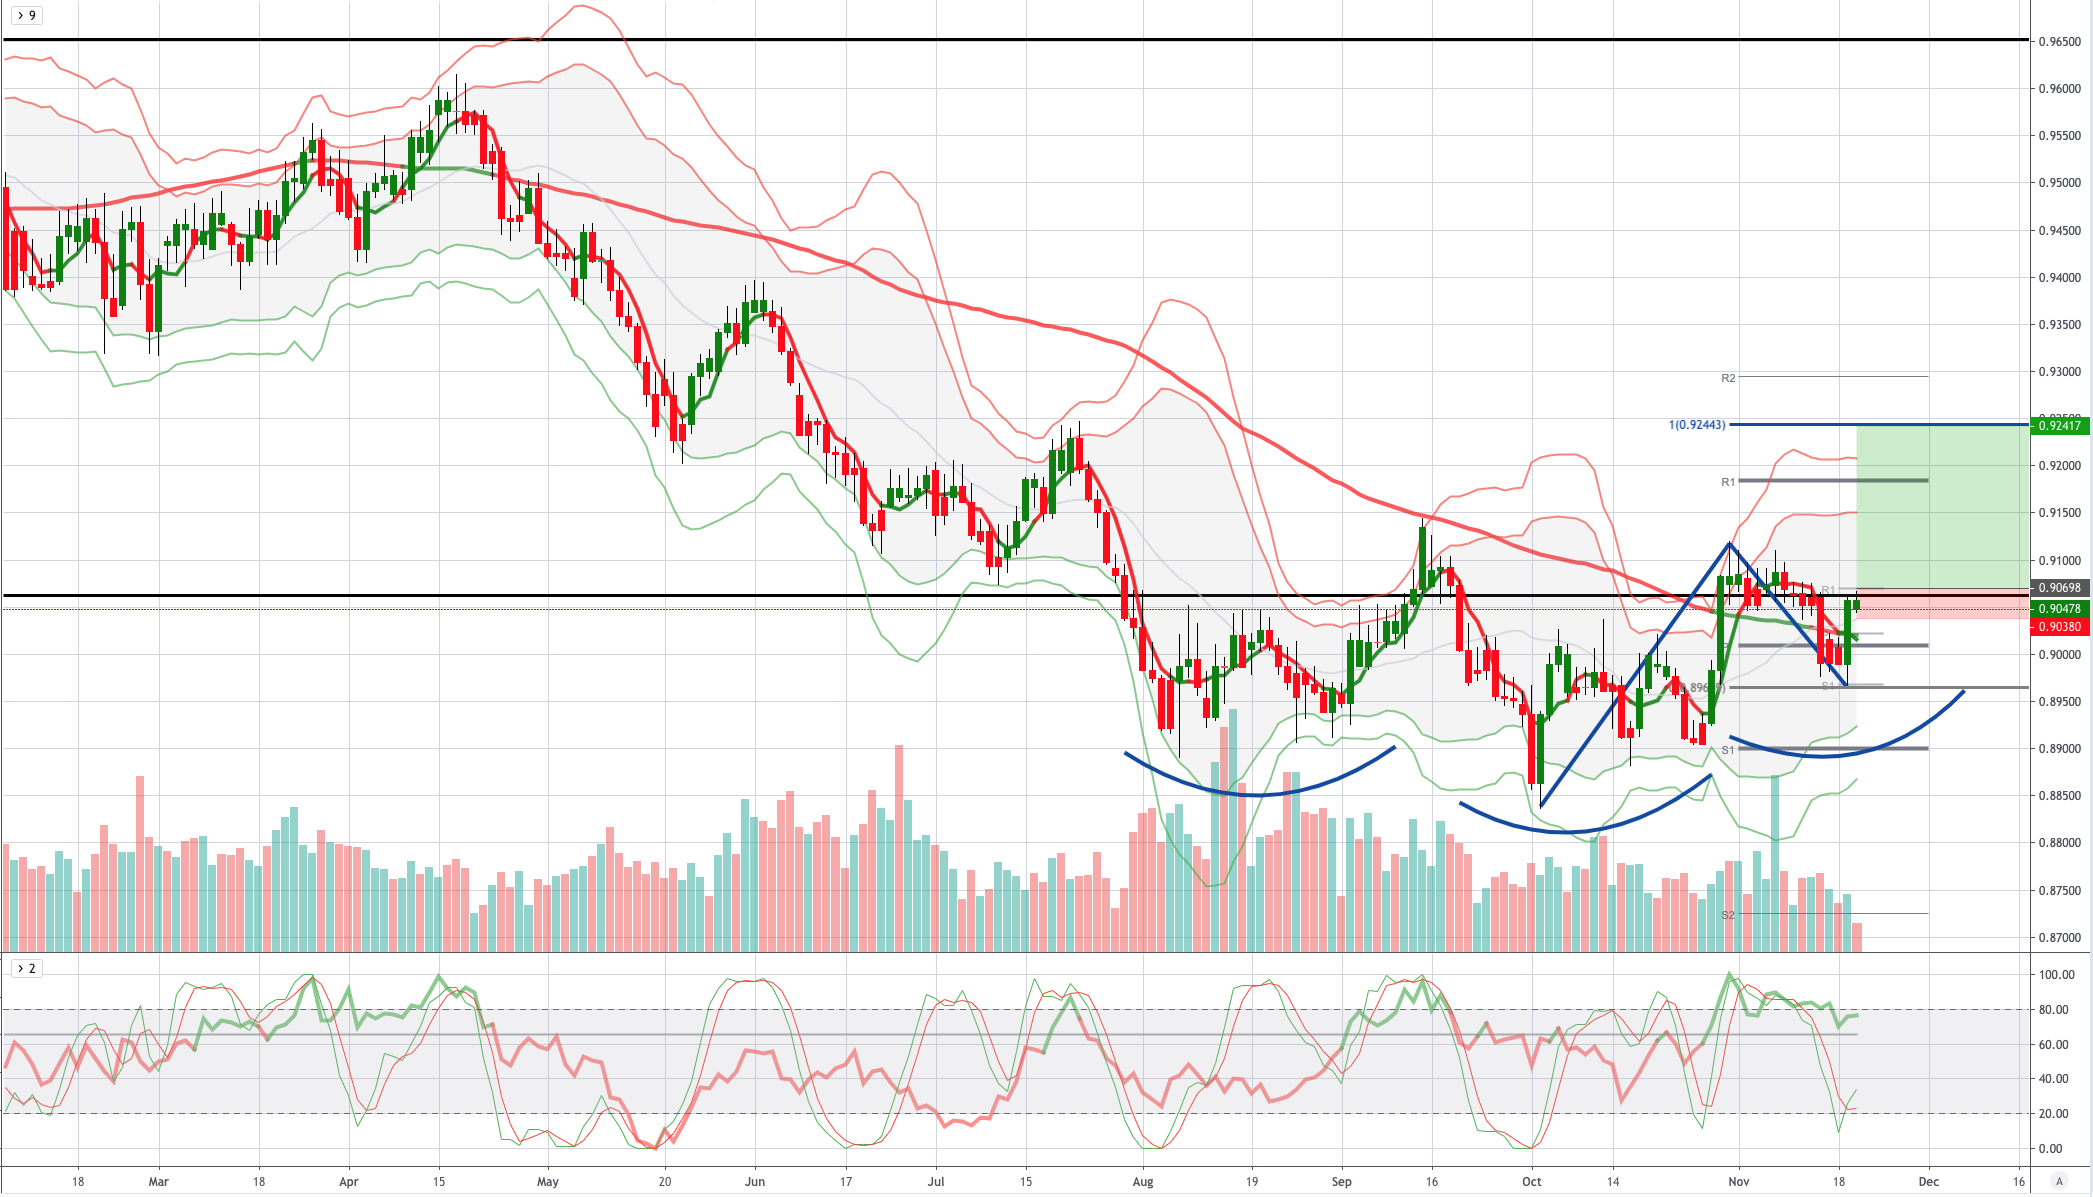
From a technical and trading perspective, the AUDCAD is potentially carving out an inverse head and shoulders pattern. Yesterdays candle printed a key reversal pattern eclipsing the prior two days price action and closing firmly above the monthly pivot, as such this should encourage further buying to emerge, I will venture long though this mornings high with a protective stop place below today's low, targeting a test of the equidistant swing objective sited at .9240
Disclaimer: The material provided is for information purposes only and should not be considered as investment advice. The views, information, or opinions expressed in the text belong solely to the author, and not to the author’s employer, organization, committee or other group or individual or company.
High Risk Warning: CFDs are complex instruments and come with a high risk of losing money rapidly due to leverage. 72% and 71% of retail investor accounts lose money when trading CFDs with Tickmill UK Ltd and Tickmill Europe Ltd respectively. You should consider whether you understand how CFDs work and whether you can afford to take the high risk of losing your money.
Disclaimer: The material provided is for information purposes only and should not be considered as investment advice. The views, information, or opinions expressed in the text belong solely to the author, and not to the author’s employer, organization, committee or other group or individual or company.
Past performance is not indicative of future results.
High Risk Warning: CFDs are complex instruments and come with a high risk of losing money rapidly due to leverage. 72% and 73% of retail investor accounts lose money when trading CFDs with Tickmill UK Ltd and Tickmill Europe Ltd respectively. You should consider whether you understand how CFDs work and whether you can afford to take the high risk of losing your money.
Futures and Options: Trading futures and options on margin carries a high degree of risk and may result in losses exceeding your initial investment. These products are not suitable for all investors. Ensure you fully understand the risks and take appropriate care to manage your risk.
Patrick has been involved in the financial markets for well over a decade as a self-educated professional trader and money manager. Flitting between the roles of market commentator, analyst and mentor, Patrick has improved the technical skills and psychological stance of literally hundreds of traders – coaching them to become savvy market operators!
