Chart of the Day Bullish USDSGD
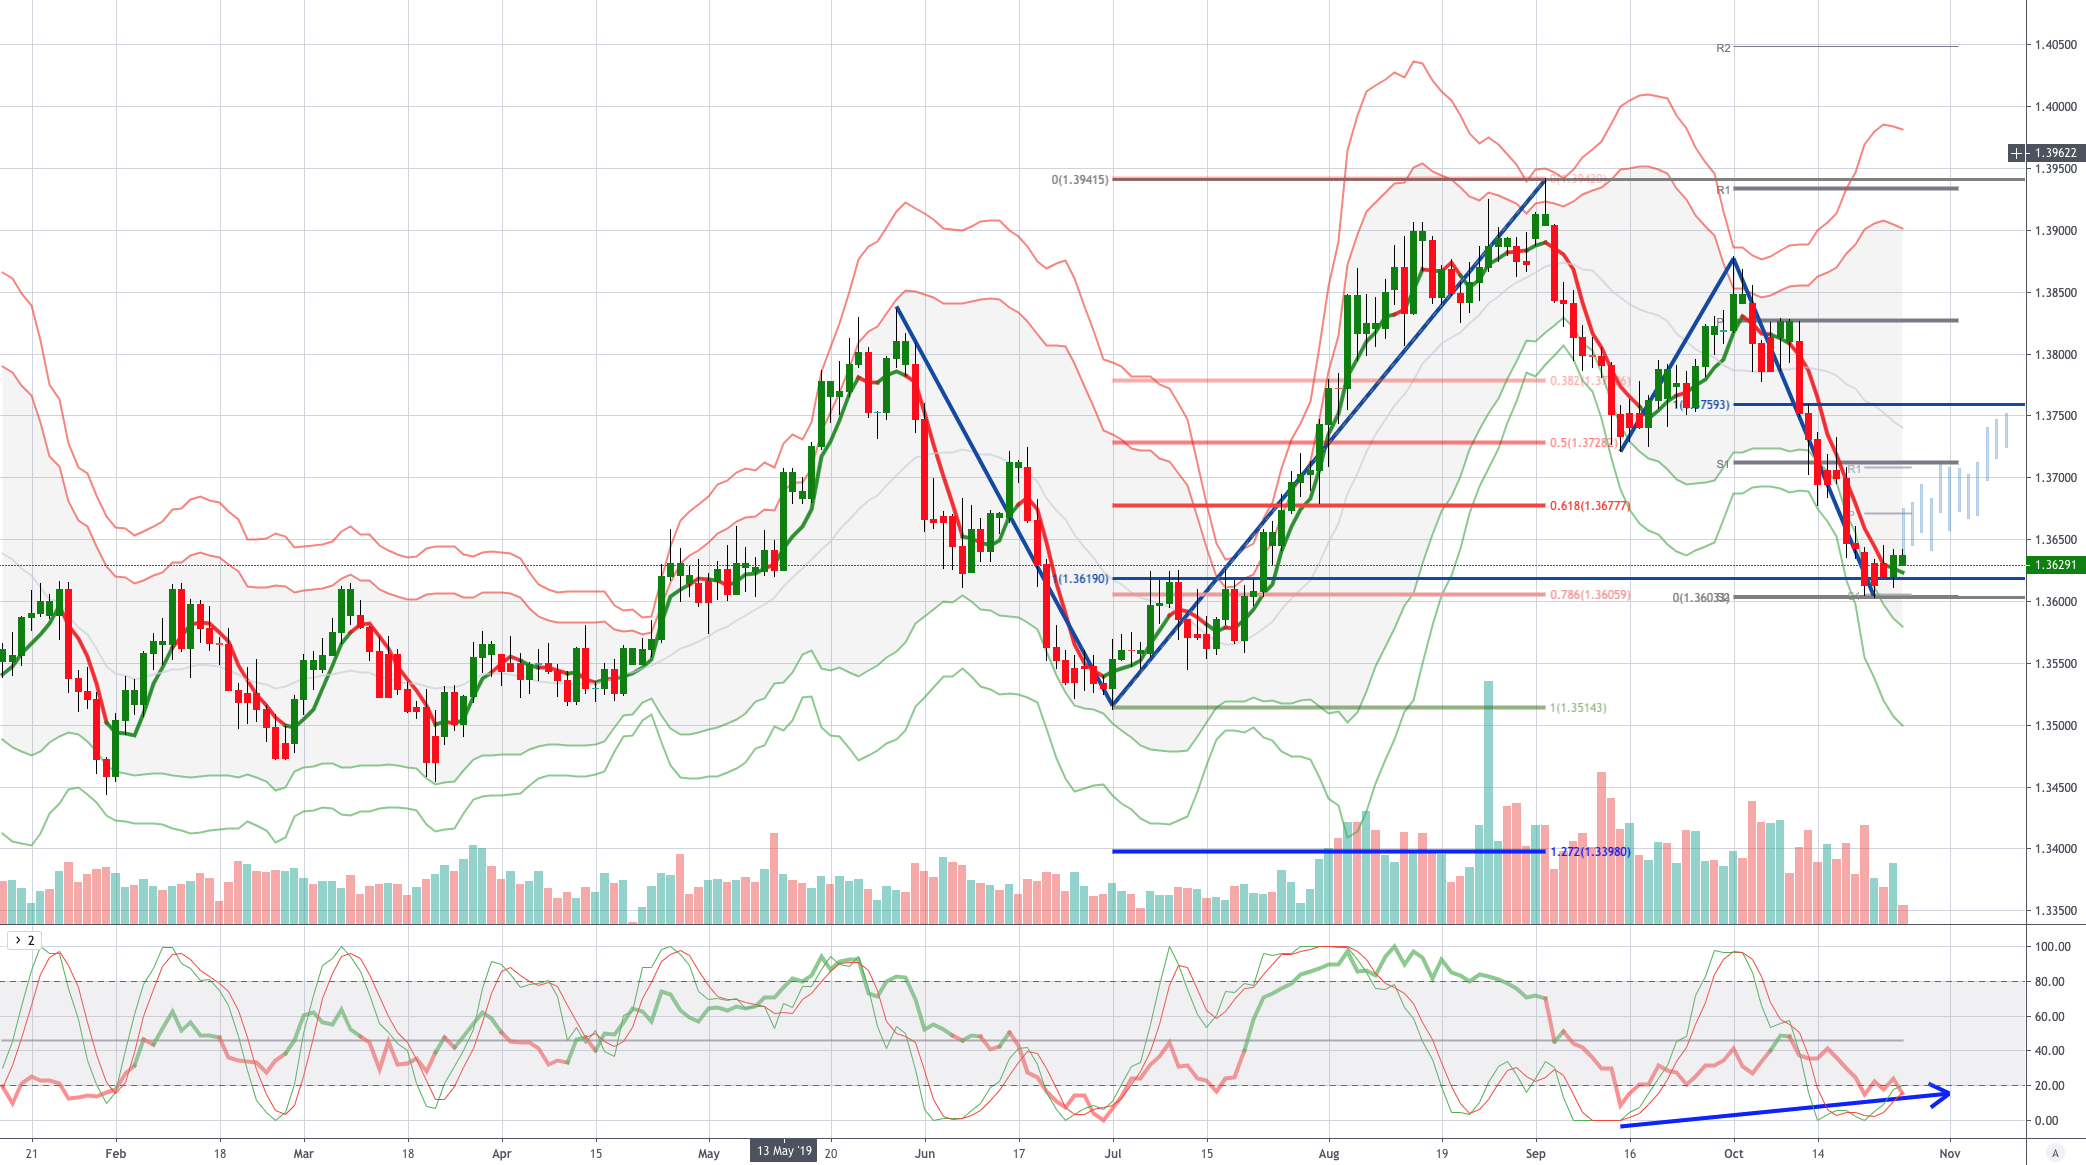
Chart of the Day Bullish USDSGD
Bullish USDSGD: USD: US PMIs point to modest expansion in economy: The flash Markit US Manufacturing PMI picked up to a six-month high of 51.5 in October (Sep: 51.1) to signal a recovery in business conditions of US factories that was driven by stronger growth of output, new orders and employment. The flash services PMI was only marginally higher at 51.0 (Sep: 50.9) over stagnating new business with anecdotal evidence of subdued demand conditions and weaker business spending. These resulted in a slightly firmer reading in the composite index at 51.2 (Sep: 51.0), reflecting modest expansion in the US economy this month. Elsewhere on the manufacturing front, the Kansas City Fed Manufacturing Index rose to -2 in October (Sep: -3), but the negative print indicates the continuous decline in overall regional factory activity in the Tenth District.
SGD: The Monetary Authority of Singapore (MAS) eased its monetary policy by reducing the rate of appreciation of the S$NEER policy band “slightly”, while keeping the width of the band and the level at which it is centered unchanged. Singapore avoided a technical recession in the third quarter of 2019, with growth at 0.1% YOY and 0.6% QOQ saar. Even as 2Q19 growth has been revised upwards to -2.7% QOQ saar (up from -3.3%), growth in the manufacturing and services sectors have been downgraded to -3.3% YOY (from -3.1% YOY) and +2.8% YOY (from +2.9% YOY).
From a technical and trading perspective the USDSGD has tested a symmetry swing support and the monthly S2, also note sentiment and momentum divergence as highlighted on the chart, buyers have emerged as confirmed with yesterday's close above the near term Volume Weighted Average Price (VWAP). A continuation today through 1.3650 would be a bullish development and opena move to test symmetry swing resistance towards 1.3750, on the day a breach of 1.36 would negate the bullish bias and suggest a test of 1.3550 before a corrective recovery develops.
Disclaimer: The material provided is for information purposes only and should not be considered as investment advice. The views, information, or opinions expressed in the text belong solely to the author, and not to the author’s employer, organization, committee or other group or individual or company.
High Risk Warning: CFDs are complex instruments and come with a high risk of losing money rapidly due to leverage. 72% and 71% of retail investor accounts lose money when trading CFDs with Tickmill UK Ltd and Tickmill Europe Ltd respectively. You should consider whether you understand how CFDs work and whether you can afford to take the high risk of losing your money.
Disclaimer: The material provided is for information purposes only and should not be considered as investment advice. The views, information, or opinions expressed in the text belong solely to the author, and not to the author’s employer, organization, committee or other group or individual or company.
Past performance is not indicative of future results.
High Risk Warning: CFDs are complex instruments and come with a high risk of losing money rapidly due to leverage. 71% and 74% of retail investor accounts lose money when trading CFDs with Tickmill UK Ltd and Tickmill Europe Ltd respectively. You should consider whether you understand how CFDs work and whether you can afford to take the high risk of losing your money.
Futures and Options: Trading futures and options on margin carries a high degree of risk and may result in losses exceeding your initial investment. These products are not suitable for all investors. Ensure you fully understand the risks and take appropriate care to manage your risk.
Patrick has been involved in the financial markets for well over a decade as a self-educated professional trader and money manager. Flitting between the roles of market commentator, analyst and mentor, Patrick has improved the technical skills and psychological stance of literally hundreds of traders – coaching them to become savvy market operators!